“Roads? Where We’re Going, We Don’t Need Roads”
If time travel with Marty McFly and Doc Emmett Brown taught us anything, the future may never be certain. With 2018 now in the books, the one certainty investors have been forced to come to terms with, is uncertainty. While the fourth quarter of 2018 was extremely volatile for both stocks and bonds, the US stock market experienced one of the weakest Decembers over the past 100 years. But also, investors witnessed the largest stock market decline during the midterm election season dating back to 1970, which has historically been a favorable time for US stocks. As a result, the expectation of a typical post-election stock market rally is most likely no longer the path the stock market is going to take over the coming months. Instead, we believe that it will more closely follow a path that looks similar to 2000, 2011, or 2015-16, each of which share strong similarities to the current environment.
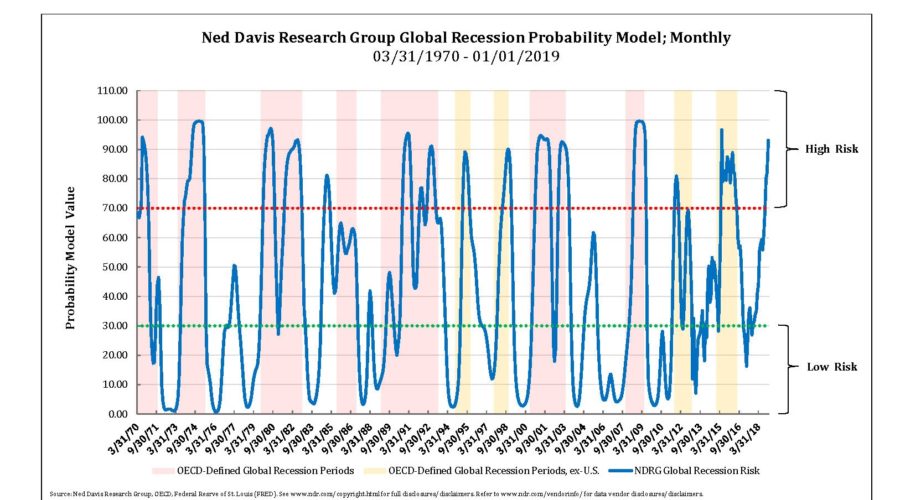
As noted in our prior market commentary and special commentary published in late October, the slowdown in global growth may be significant enough to hamper the post-election stock market rally, and continued slowing on a global scale appears to be doing just that. The chart below illustrates the Ned Davis Research Global Recession Probability Model, which is a strong indicator of global recession risk, moved from the moderate-risk zone to the high-risk zone in October of last year (above 70), and has continued to climb, with the most recent reading at 93.12 for January 2019.
While there have been a few cases over each decade this has occurred, I will focus on the similar cases during 2000, 2011, and 2015, as they may give us better insight as to future behavior of the stock market. Below are similarities across each of those years:
• The Ned Davis Research Group Global Recession Probability Model was either in the high-risk zone, or rapidly moving toward it; • Stocks experienced a decline of 12% or more; • External macro events created investor concern
o 2000 – Presidential election that was elevated to the Supreme Court o 2011 – Greek debt crisis o 2015 – Greek debt default & slowing Chinese economic growth, along with a sharp decline in oil prices o 2018 – Concerns over the pace of interest rate hikes and trade partner tensions increasing
In addition to the above, in all cases except for 2011, rising interest rates were of major concern. Conversely, here some notable differences:
• The US slid into a recession shortly following the 2000 case, but not following the 2011 or 2015 cases • Stock market valuation was substantially higher in 2000 than in 2011 or 2015 • The Federal Reserve had been cutting interest rates and adding liquidity to the markets throughout 2011 and 2015, while only increasing rates in 2000 (no liquidity being added)
The 2000 Decline:
When analyzing the decline of 2000, one of the two most notable similarities between the current market and the market then are that several valuation measures are near record highs. This can be seen on the chart below, which examines the valuation of stocks relative to sales:
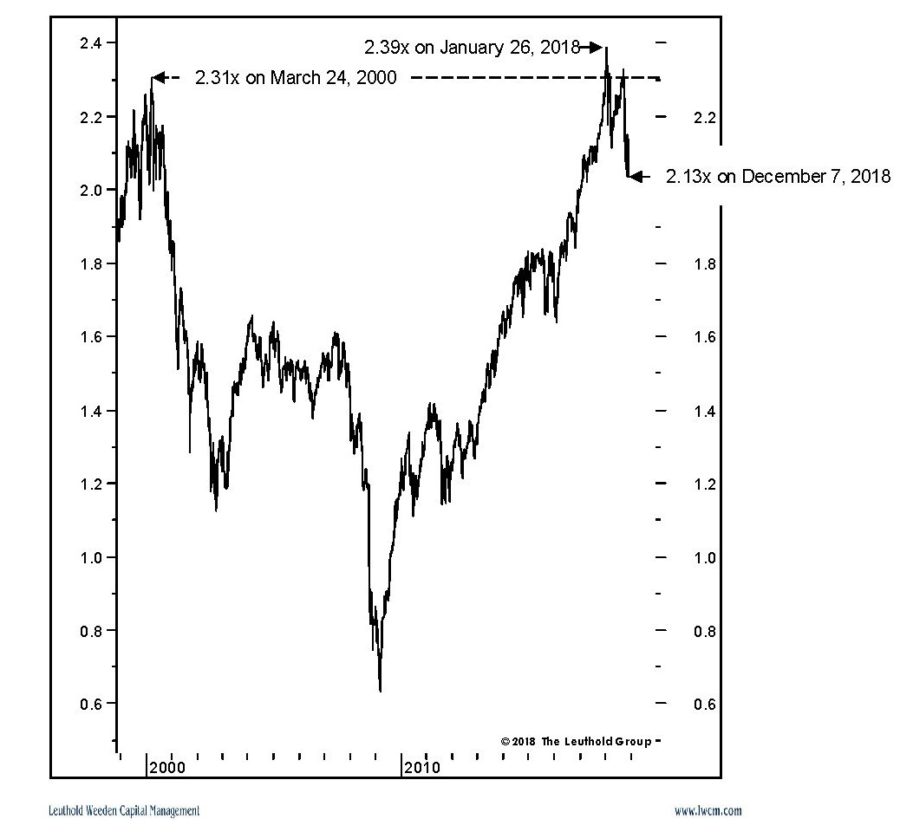
The other major similarity is that stocks set new highs early on in the year, then struggled to get back to those highs until late in the summer, and then proceeded to post significant declines late in the year. With the 2000 example, the depth and duration of the deterioration was quite long due to the sizable amount of decline needed to bring the market back to more normal valuation levels. Increased risk aversion from investors also helped fuel the decline as a result of the economic recession and the 9/11 terror attacks.
The 2000-2002 stock market decline was ultimately very profound, with stocks losing more than 45% of their value by late 2002. The decline was not an extended move to the bottom, as there were twelve interim stock market rallies of at least 5%, of which, four resulted in rallies of 10% or more. These rallies began with the hopes that the worst was over, but continued economic weakness and geopolitical concerns weighed on the market and investors. Each rally ultimately ran out of steam and moved to a lower low until more normal levels of valuation were reached, while investor pessimism toward stocks and the economy continued to increase.
The 2011 Decline:
The combination of concerns of a new Global Financial Crisis, sparked by the possibility of Greece defaulting on its debt, thereby creating a domino effect by bankrupting a number of large European banks, caused enough of an economic slowdown to push the Global Recession Risk model back into the high-risk zone. Coupled with European concerns, US stocks grew weaker due to a government shutdown in July and August, as well as a fight over raising the government’s debt ceiling. During this time, the credit rating of the US dropped below AAA, marking the first time in history it had ever been lowered.
Stocks initially declined by more than 12% through July and August, but then rallied almost 9% before moving back to a lower low in September. Beginning in October, stocks began to rebound quickly as the pieces were put into place to resolve the Greek debt crisis and help ensure the viability of European banks.
The 2015 Decline:
The 2015 decline came with a slowdown in economic growth, despite accommodative interest rate and bond purchasing policies by Central Banks from around the world, which unsettled global markets. Coupled with a devaluation of the Chinese Yuan and a steep decline in oil prices as Saudi Arabia was increasing oil production only added to the turmoil. Stocks declined by over 12%, with most of the decline coming over just a few short weeks, but then rebounded by approximately 12%, nearing their prior highs, before embarking on a second decline of more than 13%, before finding their final lows.
After two periods of historically high volatility, stocks began to rebound rather quickly, at approximately the same time the Global Recession Risk model moved down, out of the high-risk zone, and as the 2016 Presidential election came to a close.
The 2018 Decline:
The strong similarities to the three prior periods noted above do give us a potential roadmap to follow, and one important aspect is that the decline should not go much deeper if we do not see economic weakness in the US increase. My team and I will also be watching closely the ability of the stock market to avoid moving below the lows that were set in December. If the market were to move below those December lows in a meaningful way, and economic growth in the US continues to weaken, it could be a strong indication that we would be tracking a 2000-2002 type of decline.
In Summary:
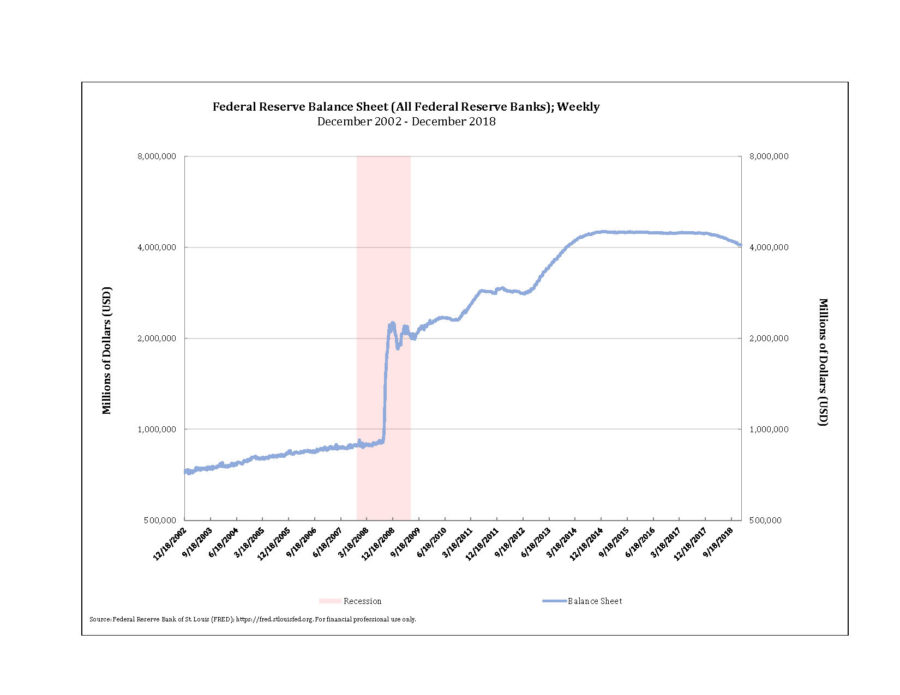
The market decline over the past few months looks similar to prior declines that we have seen in 2000, 2011, and 2015-2016. But the current profile looks most like the decline of 2000, particularly due to stretched market valuations, and an environment where the Federal Reserve has been increasing interest rates and reducing liquidity (see chart below):If recession risk remains low in the US, we may be able to avoid a longer and deeper decline. My team and I remain cautious, and will be vigilant until economic and market performance begins to show that we are not tracking a 2000-like case, which eventually led to significantly lower lows for the stock market.
While markets may be uncertain, we remain committed to ensuring the protection and preservation of capital for all of our investors, and will look for those times to allocate opportunistically as conditions turn favorable. We look forward to a positive and prosperous 2019.
Sincerely,
Michael Ball, CFP®
Lead Portfolio Manager
Opinions expressed are not meant to provide legal, tax, or other professional advice or recommendations. All information has been prepared solely for informational purposes, and is not an offer to buy or sell, or a solicitation of an offer to buy or sell, any securities or instrument or to participate in any particular trading strategy. Investing involves risk, including the possible loss of principal. All opinions and views constitute our judgment as of the date of writing and are subject to change at any time without notice. The Dow Jones Industrial Average is a price-weighted average comprised of 30 significant stocks traded on the New York Stock Exchange and NASDAQ. The S&P 500 Index is an unmanaged market capitalization weighted price index composed of 500 widely held common stocks listed on the New York Stock Exchange, American Stock Exchange and Over-The-Counter market. Indexes are provided exclusively for comparison purposes only and to provide general information regarding financial markets and no investment can be made directly into an index. These indices or funds referenced in the article should not be used as a comparison of managed accounts or suitability of investor’s current investment strategies. If the reader has any question regarding suitability or applicability of any specific issue discussed above, he/she is encouraged to consult with their licensed investment professional. The value of the index varies with the aggregate value of the common equity of each of the 500 companies. The S&P 500 cannot be purchased directly by investors. This index represents asset types which are subject to risk, including loss of principal. Investors should consider the investment objectives, risks, charges and expenses of the underlying funds that make up the model portfolios carefully before investing. The ADV Part 2 document should be read carefully before investing. Please contact a licensed advisor working with Weatherstone to obtain a current copy. If the reader has any question regarding suitability or applicability of any specific issue discussed above, he/she is encouraged to consult with their licensed investment professional. Weatherstone Capital Management is an SEC Registered Investment Advisor with the U.S. Securities and Exchange Commission (SEC) under the Investment Advisers Act of 1940. Weatherstone Capital Management is not affiliated with any broker/dealer and works with several broker/dealers to distribute its products and services. Past performance does not guarantee future results.


