One of the biggest challenges that we as investors face is our own natural tendencies, or as many economists describe it, our behavioral biases. These cover such areas as anchoring biases, where we adjust our expectations of where prices should go, based upon where prices have recently been. The disposition effect, whereby we tend to sell winning investments too quickly and stay with losing investments too long. And then there is the home bias, where we prefer domestic markets for not quite rational safety reasons, despite the possibility of better returns over time from investments abroad.
This last behavioral bias plays a part in the topic I want to discuss today, the likelihood of international stocks outperforming domestic stocks over the next 5-10 years. In prior newsletters we have discussed the fact that international markets are cheaper than the U.S. stock market. Additionally, as the global economy recovers from a series of economic slumps, we could see a sustained period where international stocks become an attractive place to be invested during the remainder of the current bull market. We have begun to see that change in performance taking place, so I would like to revisit the reasons we may see this continue to happen over the coming decade and what may be driving it now.
Most investors are not big fans of international investments for a variety of reasons. There have been countries such as Japan, which was a global economic powerhouse and about the best stock market you could have invested in during the 1970’s and 1980’s, that has subsequently been a very poor performer. Its market traded at levels for more than 25 years that were only about half of what they were at their peak. If we look at markets outside of the U.S., although many of them have provided good long-term returns, they have not been good investments in recent years. In fact, there are no major exchange traded mutual funds that invest in developed markets, emerging markets, Asia, Latin America, or European stocks that are above their pre-financial crisis market highs of 2007-2008.
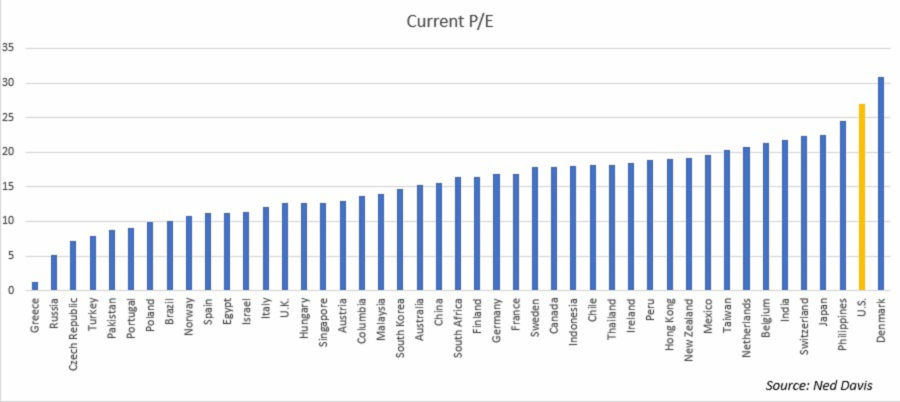
The United States has been a far better place to invest than nearly anywhere else in the world over the past ten years. This is largely due to two significant economic slowdowns outside the U.S. since 2010, with one occurring from mid-2011 into early 2013, and being primarily the result of the Greek debt crisis. The second started in early 2015 and lasted until the fall of 2016. It was heavily influenced by slowing growth in Europe, severe recessions in Brazil and Russia, weakness in Japan and slowing in China and India. While these economic slowdowns have hurt the growth in these regions, they have also created wide market valuation gaps between the United States and most of the rest of the world, as shown in the chart below.
So what does this mean for investors? Valuations have been cheaper outside the U.S. for several years, yet that has not helped foreign markets provide better investment returns than the U.S., so why might now be different? Let’s first spend a few minutes looking at the role that valuation plays in long-term returns. One of the most frequently repeated axioms for investment success is to “buy low and sell high.” When looking at prices only, we can only know what was a high or a low price with the benefit of hindsight. Yet, by using valuation metrics, we can have a more objective way of measuring if the prices that we are paying are high or low based upon prior historical readings of factors that use other components along with prices.
One of the most effective valuation measures is the Cyclically Adjusted Price Earnings Ratio (CAPE) that was developed by Robert Shiller from Yale University, and for which he earned a Nobel Prize in Economics in 2013. In looking at whether this valuation measure is useful on a global basis, there have been several studies done to determine the usefulness of this index on a global basis, and though the data for international markets does not have as long of a time span as the U.S. results have been quite similar.
In research done by Star Capital, a German based money manager that has done some impressive research in global valuations, when looking at CAPE valuation on a global basis they observed that, “In all countries a relationship between fundamental valuation and subsequent long-term returns can be observed. With the exception of Denmark, a low CAPE (below 15) was always followed by greater returns than a high CAPE.” CAPE also allows for risk to be gauged in the S&P 500 as well as other international equity markets. These findings show that along with higher expected returns, low market valuations are typically also accompanied with lower maximum drawdowns, and high market valuations face higher risks and lower expected returns. They further observed that based upon current CAPE valuations as of 6/30/2017 the expected returns for the United States relative to developed and emerging markets were as follows:
10-15 year expected annual total return
United States 3.30%
Developed Markets 6.10%
Emerging Markets 6.70%
Source: Star Capital
In the current environment, we are seeing an uptick in the performance of global economic data. Indicators, such as the Global Purchasing Managers Index (PMI) is at its strongest level since May of 2011 after a brief pause earlier this summer. The number of countries whose new orders outpaced inventories rose to 100%, the best level since January 2010, and global export orders rose at their fastest pace since June of 2011. Finally, the percentage of individual countries with PMI’s showing expansion, rose to 96%, which is the most since January of 2011.

With a broad-based economic recovery that seems to have staying power, combined with improving performance from their stock markets, investors are beginning to take renewed notice. However, many investors, both individual and institutional, are slow to embrace these markets due to more than a decade of poor performance. Like the case of Japan, it is possible for a market that has been doing quite well for a period of time to become a significant laggard at another point of time in the future. Could this happen to the U.S.?
One of the greatest risks to Japanese investors occurred if they were unwilling to be flexible about where they allocated their investment dollars. In the early 1990’s, Japanese investors who were unwilling to invest much of their equity money outside of Japan, either because they felt that the superior returns of their market would continue or because they were more comfortable with their home market, ended up with a dismal return for multiple decades. Perhaps we are in a similar place, as we in the United States find ourselves looking back and seeing superior returns from our own markets yet also faced with elevated valuations that history suggests are typically followed by below average long-term returns. It may be time to become comfortable with an increasing portion of our equity portfolios being invested overseas.
In looking at how this relates to the current positioning in equity portfolios managed By Weatherstone, we have been increasing our international equity exposure in the equity portfolios where we have that flexibility in recent months. For example, in our Focused Growth strategy, we have increased equity exposure from near zero to over 40% of the portfolios allocation. We expect that above-average international allocations will increasingly become the norm for our portfolios in the coming years. It may be more uncomfortable investing abroad, but history suggests that it will be more rewarding.
Michael Ball, Lead Portfolio Manager,
William Penfold, Analyst Intern
Sources and Disclosure:
- Star Capital Website Website
- Ned Davis Research 2017
- JP Morgan Website
Opinions expressed are not meant to provide legal, tax, or other professional advice or recommendations. All information has been prepared solely for informational purposes, and is not an offer to buy or sell, or a solicitation of an offer to buy or sell, any securities or instrument or to participate in any particular trading strategy. Investing involves risk, including the possible loss of principal. All opinions and views constitute our judgment as of the date of writing and are subject to change at any time without notice. The Dow Jones Industrial Average is a price-weighted average comprised of 30 significant stocks traded on the New York Stock Exchange and NASDAQ. The S&P 500 Index is an unmanaged market capitalization weighted price index composed of 500 widely held common stocks listed on the New York Stock Exchange, American Stock Exchange and Over-The-Counter market. The Dow Jones Transportation Average is a price-weighted average of 20 transport stocks in the United States. The Dow Jones Utility Average is the price-weighted average of 15 utility stocks traded in the United States. The S&P MidCap 400 Index is comprised of companies across different sector that are between $750 Million and $3 Billion in market capitalization. The S&P SmallCap 600 covers a wide range of small cap stocks, market capitalization that range from $400 Million to $1.8 Billion, and is weighted according to market capitalization. The S&P 500 Energy Sector is comprised of companies included in the S&P 500 that are classified as members of the GICS® energy sector. The MSCI World Index Ex US is a free-float adjusted market capitalization weighted index designed to measure market performance of developed markets that exclude the United States. The MSCI Emerging Markets Index is a free float-adjusted market capitalization index designed to measure equity market performance of 23 emerging market countries. Indexes are provided exclusively for comparison purposes only and to provide general information regarding financial markets and no investment can be made directly into an index. These indices or funds referenced in the article should not be used as a comparison of managed accounts or suitability of investor’s current investment strategies. If the reader has any question regarding suitability or applicability of any specific issue discussed above, he/she is encouraged to consult with their licensed investment professional. The value of the index varies with the aggregate value of the common equity of each of the 500 companies. The S&P 500 cannot be purchased directly by investors. This index represents asset types which are subject to risk, including loss of principal. Investors should consider the investment objectives, risks, charges and expenses of the underlying funds that make up the model portfolios carefully before investing. The ADV Part 2 document should be read carefully before investing. Please contact a licensed advisor working with Weatherstone to obtain a current copy. If the reader has any question regarding suitability or applicability of any specific issue discussed above, he/she is encouraged to consult with their licensed investment professional. Weatherstone Capital Management is an SEC Registered Investment Advisor with the U.S. Securities and Exchange Commission (SEC) under the Investment Advisers Act of 1940. Weatherstone Capital Management is not affiliated with any broker/dealer, and works with several broker/dealers to distribute its products and services. Past performance does not guarantee future results.


