Global Economic Update
One of the largest challenges in financial markets over the past few years has been a steadily weakening global economic environment. This has led to aggressive bond buying and interest rate cuts by Central Banks from around the world, and increased anxiety over events that could have a significant impact on economic growth such as the vote in late June by the United Kingdom regarding whether they wanted to remain part of the European Union or not, as well as the decline of more than 50% in oil prices over the past two years. In our prior quarterly update I discussed the global economic outlook after the Brexit vote. This quarter I want to continue that topic by looking at what has changed, where we see some improvement, and where there continues to be high risk.
European Banks
In our last commentary I highlighted the importance of the action of European banks which were being challenged by both a weak economy and difficulty maintain profitability as bonds yields have been pushed to negative levels across Europe. It is an area that we have continued to monitor, and if you look at the headlines with disconcerting stories about the possibility of Deutsche Bank potentially becoming financially insolvent due to a proposed fine of $14 Billion by the U.S. Government for the their involvement in the 2008 financial crisis, and the bank only having about $6 Billion in reserves for such fines, it can be quite disconcerting. With Deutsche Bank’s having a current market value of only about $15 billion, there is certainly the potential that the required payment of such a fine could conceivably put the bank out of business. It would seem that we could be on the cusp of a dire banking crisis, yet when we look more broadly at several of the other major European banks, the trend has been toward rising rather than falling stock prices. Here is a rundown of their price performance in the 3rd quarter.
| Name | Ticker Symbol | 3rd Quarter return |
| Deutsche Bank | DB | -4.66% |
| Credit Suisse | CS | +27.8% |
| United Bank of Switzerland | UBS | +5.09% |
| Royal Bank of Scotland | RBS | -0.85% |
| Barclays | BCS | +15.1% |
Source: Yahoo Finance (1)
So while there is still more negative news than positive news coming out about the European banks, the improving trend in the stock prices of many of these banks is a positive sign for the health of Europe’s banking system, as well as to their economic prospects. We will continue to watch this area closely.
Global Manufacturing
One of the best ways to measure the strength or weakness of the global economy is through the growth or decline in manufacturing activity. The following chart displays the Global Purchasing Managers Index, which is a survey that is put together monthly by JP Morgan. A reading above 50 indicates expansion in the manufacturing sector, and the higher the number is above 50 the stronger the growth. If the number is below 50, manufacturing is considered to be contracting. The index has been trending steadily downward since 2014, and in February and May of this year it hit a level of 50, meaning that manufacturing growth had essentially stalled out. However, since that time the index has steadily climbed and currently is at a reading of 51, which is the strongest reading since November of 2015. This increase in activity, which has been improving across both developing and emerging markets, is a significant positive for global economic growth.
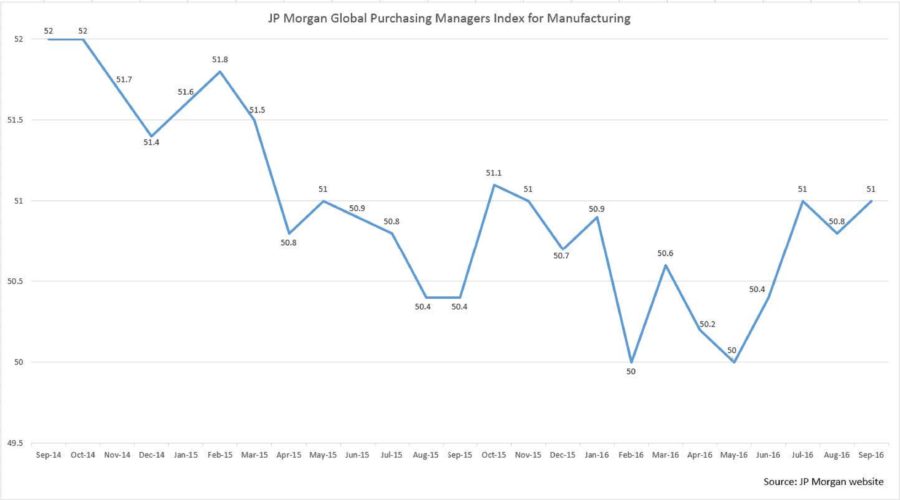
(2)
U.S. Growth still below stall speed
A particular concern for us over the past five years is the frequent dips that we have seen in our economic growth as measured by the Gross Domestic Product (GDP), dropping below the important 2% annualized growth level which we often refer to as “stall speed” for the U.S. economy. This 2% demarcation level is referred to as stall speed due to its historical significance as being an important precursor of recessions based upon research from the Federal Reserve showing that from 1947 to 2011, when year-over-year GDP growth drops below a 2% annualized rate a recession has followed within 12 month about 70% of the time. Yet, as can be seen on the following charts, since 2011 we have dropped below the 2% threshold four times, yet have been able to avoid recession, which is unprecedented in our post-war economic history. The implementation or expansion of bond buying programs by the Federal Reserve during these recent slowdowns likely helped us avoid slipping into a recession. However, the most current case of dropping below stall speed comes at a time when the Federal Reserve has curtailed its bond buying program, and is now looking to raise interest rates. It puts us in a higher risk position, so the recent improvements in foreign economic growth are a welcome tailwind for our economy.
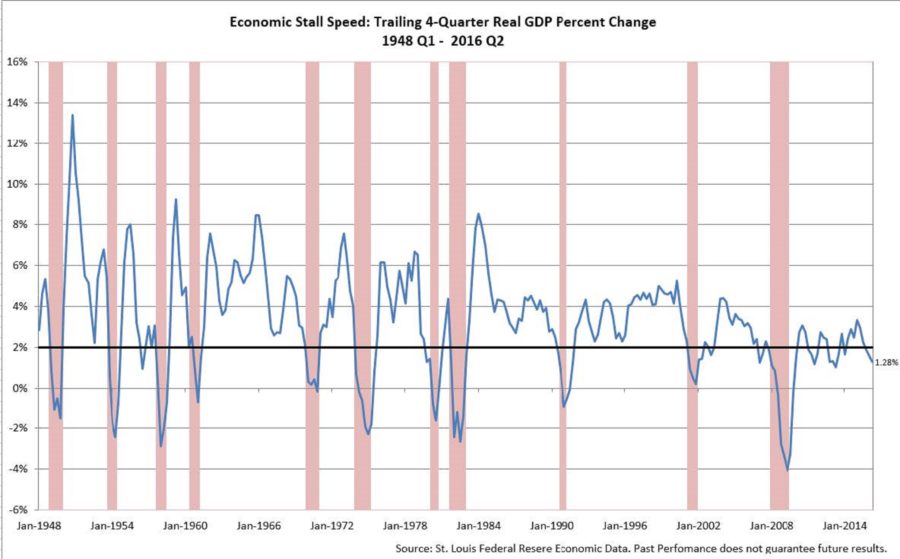
(3)
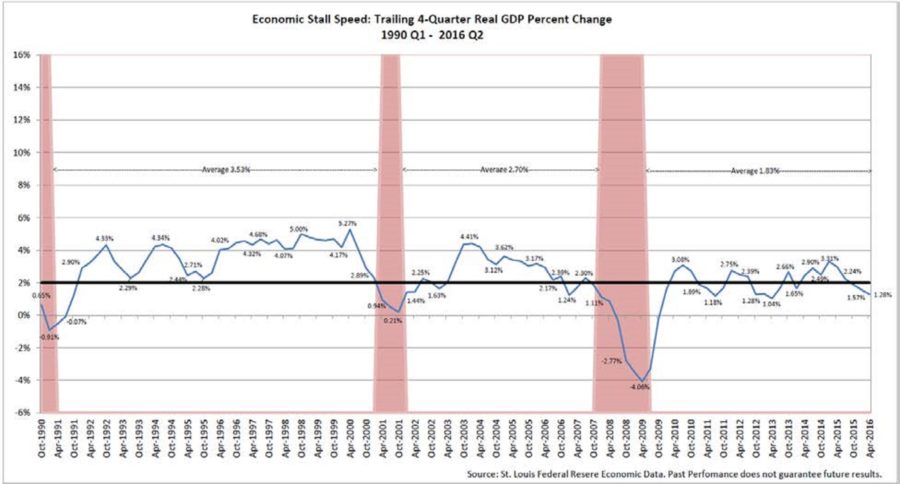
(4)
In Summary
The challenges of a weak global economy and a domestic economy stuck in a very low growth range has weighed on foreign and domestic stock markets over the past couple of years, and we are seeing the impacts in lower bond yields, declining earnings, and stock markets that are having difficulty making any significant gains. With a small, but increasing number of improving global growth measures, we may be seeing the economic picture move from being a headwind for stocks to being a tailwind for them.
Adjustments to Weatherstone investment portfolios
We entered the third quarter with above-average cash holdings due to weakness across a number of our risk measurement models. This was helpful in minimizing the volatility that was experienced in the aftermath of the Brexit vote. As our risk measurement models became more positive at the end of July, we increased exposure to both domestic and foreign markets in early August. That exposure was reduced somewhat in mid-September as foreign positions were sold due to deterioration in our foreign risk measurement models.
Bond positions remained largely unchanged for most of the quarter, and we did eliminate a position in utilities and real estate as rising yields on government bonds put pressure on these sectors which have been popular with investors searching for higher yield. The proceeds were initially moved into money market funds, and then into high yield corporate bonds late in the quarter after a brief pullback in that bond category.
We have continued to see wide fluctuations in oil prices between $40 and $50 per barrel, and the sector continues to look quite attractive.
As we move into the 4th quarter and holiday season, we wish you joy and happiness as you spend time with family and friends, and reflect upon the many good things that you have in your life.
Michael Ball, CFP®
Lead Portfolio Manager
Sources & Disclosure:
- Yahoo Finance 2016
- JP Morgan 2016
- Louis Federal Reserve 2016
- Louis Federal Reserve 2016
Opinions expressed are not meant to provide legal, tax, or other professional advice or recommendations. All information has been prepared solely for informational purposes, and is not an offer to buy or sell, or a solicitation of an offer to buy or sell, any securities or instrument or to participate in any particular trading strategy. Investing involves risk, including the possible loss of principal. All opinions and views constitute our judgment as of the date of writing and are subject to change at any time without notice. The Dow Jones Industrial Average is a price-weighted average comprised of 30 significant stocks traded on the New York Stock Exchange and NASDAQ. The S&P 500 Index is an unmanaged market capitalization weighted price index composed of 500 widely held common stocks listed on the New York Stock Exchange, American Stock Exchange and Over-The-Counter market. The Dow Jones Transportation Average is a price-weighted average of 20 transport stocks in the United States. The Dow Jones Utility Average is the price-weighted average of 15 utility stocks traded in the United States. The S&P MidCap 400 Index is comprised of companies across different sector that are between $750 Million and $3 Billion in market capitalization. The S&P SmallCap 600 covers a wide range of small cap stocks, market capitalization that range from $400 Million to $1.8 Billion, and is weighted according to market capitalization. The S&P 500 Energy Sector is comprised of companies included in the S&P 500 that are classified as members of the GICS® energy sector. The MSCI World Index Ex US is a free-float adjusted market capitalization weighted index designed to measure market performance of developed markets that exclude the United States. The MSCI Emerging Markets Index is a free float-adjusted market capitalization index designed to measure equity market performance of 23 emerging market countries. Indexes are provided exclusively for comparison purposes only and to provide general information regarding financial markets and no investment can be made directly into an index. These indices or funds referenced in the article should not be used as a comparison of managed accounts or suitability of investor’s current investment strategies. If the reader has any question regarding suitability or applicability of any specific issue discussed above, he/she is encouraged to consult with their licensed investment professional. The value of the index varies with the aggregate value of the common equity of each of the 500 companies. The S&P 500 cannot be purchased directly by investors. This index represents asset types which are subject to risk, including loss of principal. Investors should consider the investment objectives, risks, charges and expenses of the underlying funds that make up the model portfolios carefully before investing. The ADV Part 2 document should be read carefully before investing. Please contact a licensed advisor working with Weatherstone to obtain a current copy. If the reader has any question regarding suitability or applicability of any specific issue discussed above, he/she is encouraged to consult with their licensed investment professional. Weatherstone Capital Management is an SEC Registered Investment Advisor with the U.S. Securities and Exchange Commission (SEC) under the Investment Advisers Act of 1940. Weatherstone Capital Management is not affiliated with any broker/dealer, and works with several broker/dealers to distribute its products and services. Past performance does not guarantee future results.


