A Bear Market for Bonds?
The 1st quarter of 2021 has been positive for stocks but a very poor quarter for some bond market segments. One of the most commonly followed bond benchmarks, the Barclays Aggregate Bond Index, has had its 4th worst quarterly performance since 1979 with a loss of 3.37%. The first quarter of 2021 was the worst quarterly performance since 1981. While the decline does not seem that steep, consider that the yield on the index is only about 1.14%, so it would take nearly three years to recoup the losses if bond prices stay flat and only rely on the interest income to recover from the decline.
In our commentary at the end of the third quarter in 2020, we discussed the abnormally low level of interest rates relative to inflation. We asked the question, “Will interest rates ever rise again?” Well, here we are just six months later, and we have seen the yield on some intermediate and longer-term bonds more than double in some cases. Here is an example of some of the changes in bond yields over the past six months:
| U.S Gov’t Bond | 9/30/2020 | 3/31/2021 |
| 5 Yr. | 0.33% | 0.92% |
| 10Yr. | 0.77% | 1.74% |
| 30 Yr. | 1.57% | 2.41% |
So, after a challenging quarter for bonds, it is worth asking the questions, “Is the worst over?” and “Where might we go from here?” While we will not claim any crystal ball on the future, we will look at the primary drivers of either a positive or negative outcome going forward and some discussions on how we have been navigating the environment in our fixed-income portfolios over the past few months.
Three things causing interest rates to rise
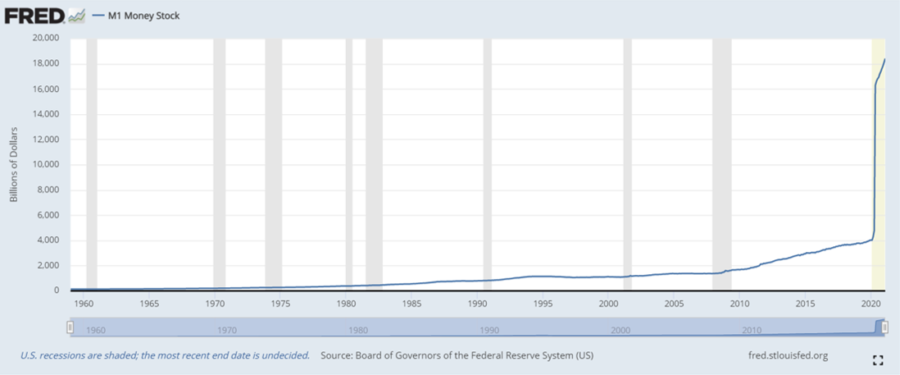
One of the most likely drivers of inflation concerns is the nearly unprecedented surge in money that the government has pushed into the economy. Here is a rather amazing fact to consider: over 35% of all U.S. dollars in circulation have been printed since March of 2020! This can be shown through the Federal Reserve’s most common money measurement known as M-1, which measures physical currency and coin, money in checking accounts, travelers’ checks (does anybody still use these?), and NOW accounts at banks and credit unions:
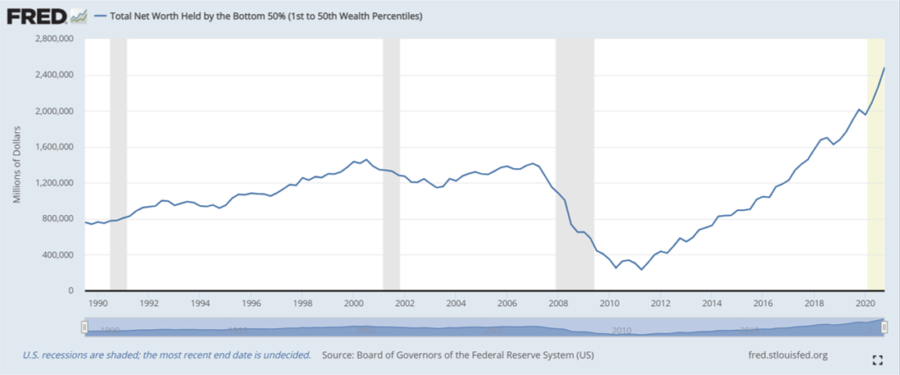
The stimulus sent out by the government over the past year is the largest transfer of wealth in history from the U.S. government to its citizens. This has pushed up the net worth of households across the full range of household wealth, as noted by the growth in the net worth of the lowest 50% of U.S. households, as shown in the chart below.
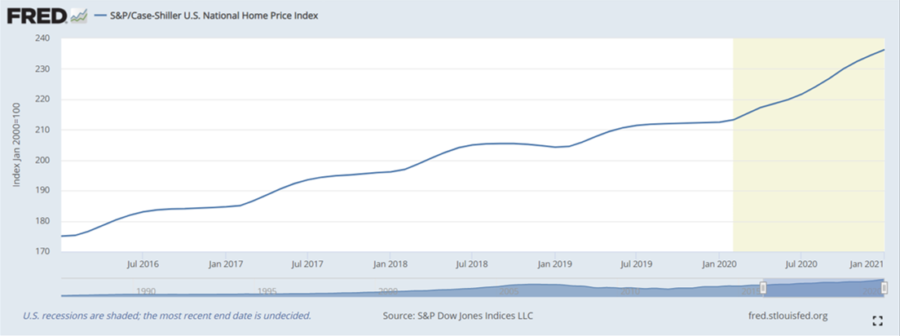
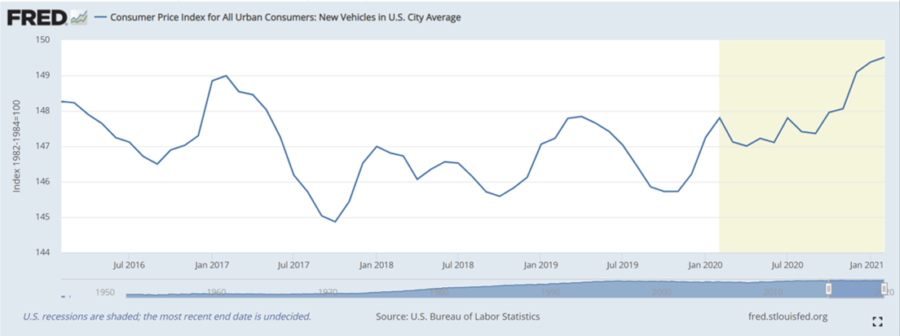
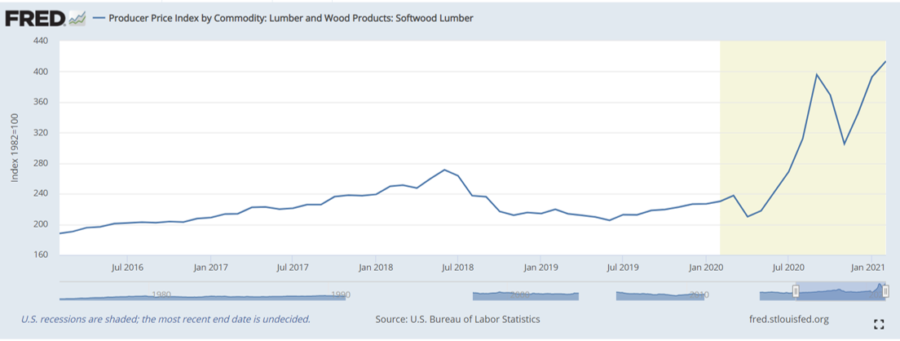
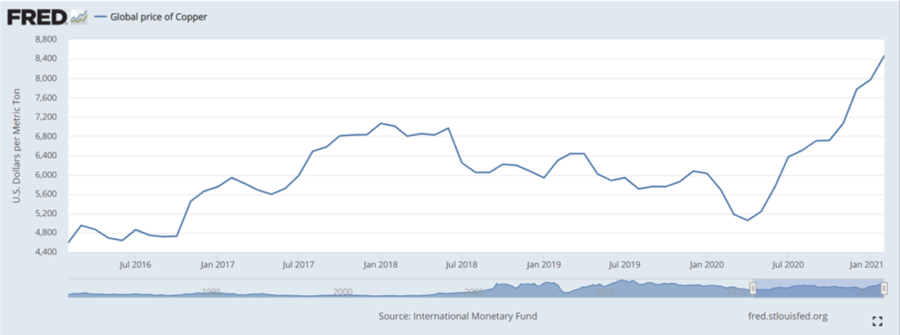
Some of this cash is being saved, but some is also going towards spending on goods and services, and it is pushing up prices from basic materials to stocks. Here is a look at some of the more interesting price changes we have seen recently:
Home Price Index – 5 yr. history
Car Price Index – 5 yr. history
Lumber price Index – 5 yr. history
Copper Price Index – 5 yr. history
The second driver is that we have a change in Federal Reserve policy. In the past six months, they have indicated that they plan to keep the short-term interest rates very low. They also want to see inflation get back to its 2% annualized target. Also, they are willing to let inflation stay above 2% for some time to make up for the time in which it has been below 2% in the past.
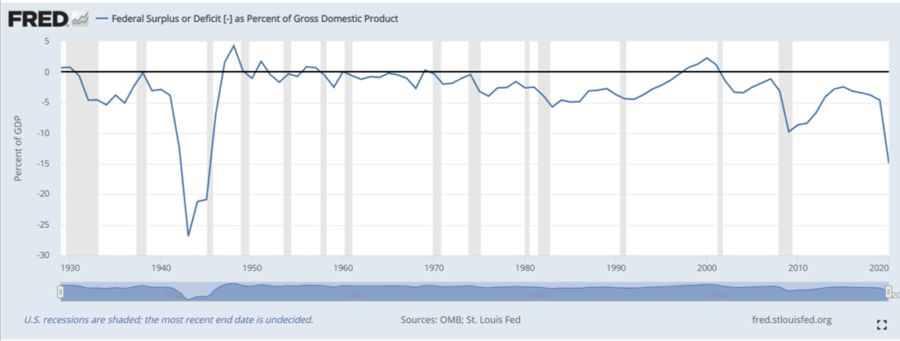
The third driver is that the government expects to issue a record amount of bonds this year to fund the various government stimulus. The chart below shows the budget deficit relative to the size of the economy. Looking back to 1930, it has only been larger during World War II.
Back to the 1950s?
While the items we have noted would indicate that a return of inflation is a nearly inevitable outcome, it is also instructive to look back in history to see if we have had similar periods without a significant uptick in inflation or bond yields. And it turns out that there was a somewhat similar period in the years following the end of World War II until the mid-1960’s. That period had several similarities to our current environment and experienced a brief jump in inflation, which could not be sustained despite above-average economic growth. During that period, there was only a gradual rise in interest rates across a number of years.
In looking at the similarities and differences between the 1950-1965 timeframe and today, one of the most striking is the similar substantial economic policy support that occurred from spending during and shortly after World War II. It was only modestly smaller than the current amount of government stimulus in relation to the economy’s total size.
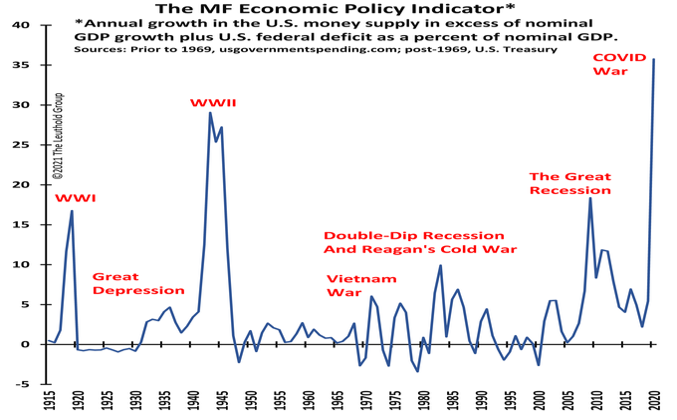
Source: Leuthold Group
After the end of the war, inflation dropped down to an average of less than 1% per year in 1948 and 1949, only to have it spike briefly higher from 1950-1951, where inflation averaged nearly 6% per year, only to drop back down and remain below 1% per year from 1952 through 1955, and then only average less than 1.75% per year over the next ten years. When we compare that against economic growth, we did see above-average growth in 1950-51 with an average gain of 8.35% per year. Still, the remaining years from 1948 through 1965 averaged growth of 3.58%, which is not that different from the average 2.26% that we have experienced from 2010 through 2019.
From 1955 through 1965, we saw inflation slowly but steadily begin to increase, and in response, bond yields did begin to gradually move higher from about 3% in 1955 to slightly above 4% in 1964.
Our thoughts and investment strategy
It seems that the Federal Reserve feels comfortable that the 1950 scenario is a more likely outcome of the current upturn in inflation expectations than a 1970’s scenario. As a result, it seems they do not feel the need to begin signaling to financial markets that higher short-term interest rates are to be expected for the foreseeable future. With a significant amount of deficit spending expected to continue for the next few years, and with foreign governments and investors not currently making any significant increases to the amount of bonds that they are buying, the excess supply will either need to be purchased by investors, or by the Federal Reserve increasing their bond purchases. The Federal Reserve is currently planning to reduce significantly their bond purchases this year, presently committing to buy only about $80 billion per month in bonds vs. an average of $197 billion per month last year.
As a result, we feel that the greater risk is for a continued increase in bond yields over the coming year or two. The primary drivers being the pressure of higher inflation and record non-wartime budget deficits. These headwinds are likely to slow investor appetite for locking in longer-term bond yields until we either reach better clarity on these two items, or we see yields rise high enough that they begin to attract significant investor interest from around the world.
We are generally quite pleased with how our income portfolios have navigated this rising interest rate environment so far. All of our internally managed Weatherstone programs have been able to post positive returns that are attractive relative to the major bond market indexes. We have been able to post these gains by investing in fixed income securities that are more economically sensitive and in which many of the securities have been trading at discounts to their maturity value. The strengthening of economic prospects is currently offsetting the negative impacts of the rising interest rates. As the economic outlook improves, we are seeing the prices on the bonds increase as the risk potential begins to diminish, and this benefits the portfolios. We have also reduced exposure to longer-term bonds and increased the amount of floating-rate bonds that we hold, as well as by adding a position to a bond fund strategy that incorporated a hedge that will benefit from rising inflation.
We believe that the current positioning leaves us in a favorable stance should inflation surprise on the upside. A significant portion of our current holdings is made up of floating-rate bonds, which can benefit if we do see an uptick in interest rates. Should rates stabilize and begin to trend lower once again, we can quickly begin to shift our bond allocations back to a higher weighting in fixed-rate bonds and look to extend the length of time until maturity in our fixed-income investments. Regardless of what the future may hold, we are likely to experience some factors impacting the bond market we have not seen for several decades.
Stay Safe,
Michael Ball CFP®
Managing Director
The Quarterly Market Commentary provides comprehensive data and commentary on the global markets, intended to help clients understand the markets while providing an in-depth review of current economic data and changing market conditions.
This document is for informational purposes only. It is educational in nature and should not be considered a recommendation of Weatherstone Capital Management’s investment management and financial planning services, strategy or any particular product in any jurisdiction. Your investment goals and objectives are unique so you are encouraged to consult with an investment professional before making any investment decisions. The comments expressed include forward-looking statements derived from Weatherstone Capital Management’s analysis of market conditions, projections and the general economy. As a result, there are no guarantees of future performance based on these statements. All opinions are current at the time of publication and are subject to change without notice. All information including returns, charts and graphs are obtained from sources believed to be reliable, but not guaranteed.
Clients cannot invest directly in market indices. Any returns illustrated in this presentation assume the reinvestment of dividends and would be lower if transaction costs and fees for asset allocation and financial planning advice were deducted.
Investing has risks, including loss of income and principal, and there are no assurances specific investment results will be achieved. Weatherstone Capital Management has no control over market volatility so investors should understand these are inherent risks with investing. Past performance does not guarantee future results. Unless otherwise stated, all data is current as of the most recent quarter end, or most recently available.
A copy of Weatherstone Capital Management’s regulatory disclosure document is available upon request and is also available on the SEC’s website at www.adviserinfo.sec.gov. For questions about this presentation, please contact Weatherstone Capital Management at (303) 452-4374.


