Economic Growth is starting to Disappoint
Since the conclusion of the Presidential Election last November, stock markets both here in the U.S. and around the world have done quite well, and optimism and economic confidence have moved to multi-year highs. While some of the optimism has been based upon expectations of tax reform that could stimulate economic growth, another important factor has been the expectation of a simplification or elimination of many Federal Government regulations. According to a 2016 story in the Washington Times, the cost of complying with federal regulations costs is just under $1.9 trillion dollars, eclipsing the amount paid by personal income taxes. (1)
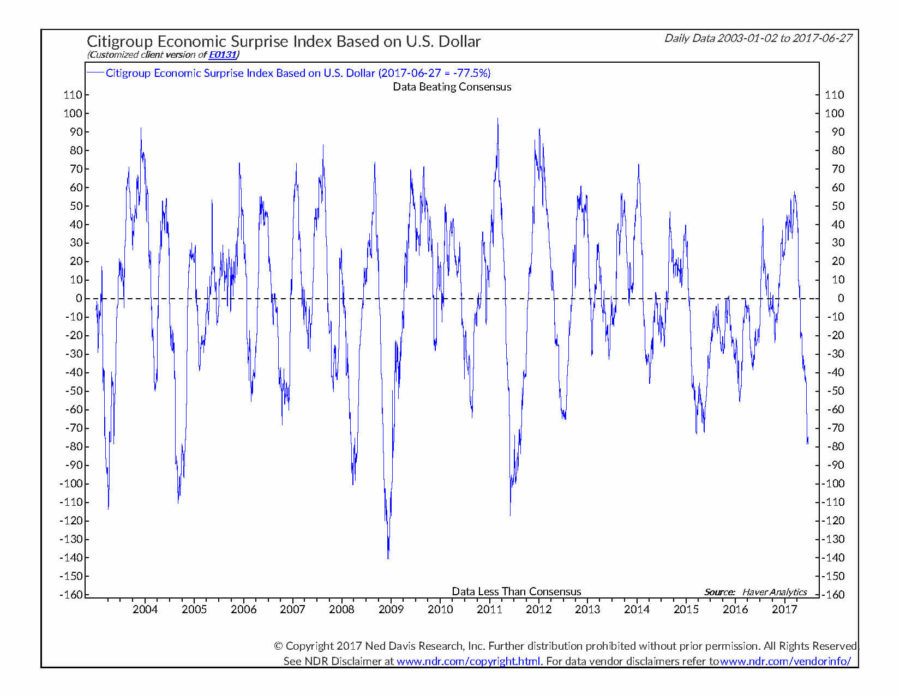
So far, tax reform has failed to materialize, and by the looks of how health care reform has fared so far in the House and Senate, it may not be an easy sell. Despite the delays and setbacks, the stock market has continued to move higher, and seems to be impervious to bad news, whether it be political, economic, or terrorist related. However, we are beginning to see a marked divergence between economic growth expectations, and actual data. In some past quarterly commentaries, we have discussed the Citigroup Economic Surprise Indexes, which measure whether economic data on balance is coming out weaker or stronger than the consensus of Economists estimates tabulated by Bloomberg News. The chart below shows the Economic Surprise Index for the United States. When the data is below the zero threshold, it means that the data is coming in weaker than expected, and if it is above zero, then data is coming in stronger than expected on balance. As the chart below shows, the data over the past several weeks has been coming in weaker than expected, and at a magnitude that is greater than we have seen in more than five years.
Is this weaker economic growth a problem for the stock market? Our answer would be that we believe that markets are ignoring the weaker data for three primary reasons:
- -Weakness is not broad based across a large number of regions and countries across the world.
- -Domestic loan growth has not turned negative even in the face of rising interest rates.
- -Earnings growth for the majority of public companies has remained positive.
With stocks trading at historically high valuation levels, this could become a problem in the future. If the slowdown appears to be more than just a pause in the economic expansion, if increasing interest rates begin to provide stiffer competition for investors’ dollars, or some other important negative development occurs.
This is a recent development that we have been monitoring, and we feel that it is important, but it has not yet impacted the positioning in any of our investment strategies.
Looking at the investment markets
Stocks have generally been good performers in the first half of the year, with foreign stocks being stronger than domestic stocks. On a sector level energy stocks have oscillated from being the strongest sector of the market in 2016, to being the weakest sector of the market in 2017. Oil has dropped back to multi-month lows on concerns over increasing energy production and renewed worries over a continued glut of oil persisting.
Most of our equity oriented investment strategies have remained nearly fully invested in stocks during the quarter, as well as for the full year. In investment programs where we have the flexibility to adjust between domestic and foreign stocks, we have increased our weighting in foreign stocks to the highest levels in 2-3 years, as the combination of better valuations in foreign stocks, and improving foreign economic growth are leading to stronger performance by those markets.
Bonds have generally seen slower growth this year than they did in 2016, due to rising short-term interest rates after two rate increases by the Federal Reserve, and lower yield differentials between high yield corporate bonds and treasury bonds. While the yield on bonds looks rather small compared to stock market returns over the past six months, it is important to remember that the expected rate of return between stocks and bonds is not all that different over the next five years, and bonds are likely to provide their rate of return with significantly less volatility.
It is also important to note that with the U.S. stock market’s recent new highs set in May, we have now entered the longest advance without a 20% decline in the stock market since 1900. We have looked at life expectancies of stock market advances and adjusted them in terms of human years, similar to the type of adjustments used to measure dog years in people years, and the current stock market advance is 95.1 years old in human terms. Whether advanced aging is in human or stock market years, it is prudent to be a little more cautious when gets to that advanced age.
We appreciate your support and confidence and hope that you are having a great summer.
Michael Ball
Lead Portfolio Manager
Sources and Disclosure:
- 1- http://www.washingtontimes.com/news/2016/may/4/compliance-with-federal-regulations-now-cost-19-tr/
- 2- Ned Davis Research 2017
Opinions expressed are not meant to provide legal, tax, or other professional advice or recommendations. All information has been prepared solely for informational purposes, and is not an offer to buy or sell, or a solicitation of an offer to buy or sell, any securities or instrument or to participate in any particular trading strategy. Investing involves risk, including the possible loss of principal. All opinions and views constitute our judgment as of the date of writing and are subject to change at any time without notice. The Dow Jones Industrial Average is a price-weighted average comprised of 30 significant stocks traded on the New York Stock Exchange and NASDAQ. The S&P 500 Index is an unmanaged market capitalization weighted price index composed of 500 widely held common stocks listed on the New York Stock Exchange, American Stock Exchange and Over-The-Counter market. The Dow Jones Transportation Average is a price-weighted average of 20 transport stocks in the United States. The Dow Jones Utility Average is the price-weighted average of 15 utility stocks traded in the United States. The S&P MidCap 400 Index is comprised of companies across different sector that are between $750 Million and $3 Billion in market capitalization. The S&P SmallCap 600 covers a wide range of small cap stocks, market capitalization that range from $400 Million to $1.8 Billion, and is weighted according to market capitalization. The S&P 500 Energy Sector is comprised of companies included in the S&P 500 that are classified as members of the GICS® energy sector. The MSCI World Index Ex US is a free-float adjusted market capitalization weighted index designed to measure market performance of developed markets that exclude the United States. The MSCI Emerging Markets Index is a free float-adjusted market capitalization index designed to measure equity market performance of 23 emerging market countries. Indexes are provided exclusively for comparison purposes only and to provide general information regarding financial markets and no investment can be made directly into an index. These indices or funds referenced in the article should not be used as a comparison of managed accounts or suitability of investor’s current investment strategies. If the reader has any question regarding suitability or applicability of any specific issue discussed above, he/she is encouraged to consult with their licensed investment professional. The value of the index varies with the aggregate value of the common equity of each of the 500 companies. The S&P 500 cannot be purchased directly by investors. This index represents asset types which are subject to risk, including loss of principal. Investors should consider the investment objectives, risks, charges and expenses of the underlying funds that make up the model portfolios carefully before investing. The ADV Part 2 document should be read carefully before investing. Please contact a licensed advisor working with Weatherstone to obtain a current copy. If the reader has any question regarding suitability or applicability of any specific issue discussed above, he/she is encouraged to consult with their licensed investment professional. Weatherstone Capital Management is an SEC Registered Investment Advisor with the U.S. Securities and Exchange Commission (SEC) under the Investment Advisers Act of 1940. Weatherstone Capital Management is not affiliated with any broker/dealer, and works with several broker/dealers to distribute its products and services. Past performance does not guarantee future results.


