The generally unexpected win for the “Leave” option in the referendum on whether the United Kingdom should stay in the European Union (the commonly called Brexit) shook up financial markets around the world, with sharp declines in the first two trading days following the vote. The initial global impact was a loss of nearly $2 trillion in market values, and then a strong rebound in most markets that restored much of that loss by the end of the month.
Over the past couple weeks, a significant amount of the news in the financial press has been full of stories about what this means. Rather than try and predict how the political and economic ramifications will play out over the coming years, which is nearly impossible due to the fact that we don’t have similar historical comparisons from which to provide context, instead, let me just make a few observations about important items to watch in the markets over the coming weeks and months, and comment on how we have adjusted investment portfolios in recent weeks.
History has shown that uncertainty shocks often have large negative macroeconomic effects. These shocks can come from almost any number of sources; political, economic, military, etc. The impact is that individuals and business become less inclined to make financial decisions until the level of uncertainty declines to a point where they become more comfortable.
As we look at the economic impact of the Brexit, economic analysis from some of the economists at Goldman Sachs estimates that the rate of economic growth in the Euro area will be reduced by .50% over the next two years with the expected growth rate moving from 1.75% to 1.25%. The impact on the larger global economy will vary based upon the amount of trade that various countries do with the United Kingdom. But in the United States for example it is expected to slow our economic growth by .1% over the next two years with new estimated growth rates of 1.9% for 2016, and 2% for 2017.
So while the impact on global growth is generally modest, the more important point is that it weighs down growth in an already fragile global economic environment. In past newsletters we have discussed the concept of “stall speed” which comes from work done by the Federal Reserve Bank of Dallas. As mentioned, we have discussed this in past commentaries, which can be found on our website, but in a nutshell, based on historical analysis, there is a nearly 70% probability of the economy going into recession when the growth rate of the economy over the past 12 months drops below 2%. We have been bouncing slightly above and below this level for much of the past 5 years, and we have thus far been able to avoid a recession, likely due in large part to extraordinary monetary policy measures by the Federal Reserve to keep interest rates very low and supportive of economic growth. Historically speaking our economic growth is low enough that there is not much of a margin of safety, so all potential shocks to economic growth should be watched closely.
While some people have predicted dire consequences from having such an important member leave the European Union, it is not an easy prediction due to the fact that this is the first test of this type to happen in the European Union. To see if this is likely to lead to a larger financial crisis there are three key areas that we will be watching. The price action of banks, Economic Surprise Indexes, and yield spreads.
Price Action of Banks
In the 2008 Financial Crisis, problems really started to pick up after we saw larger financial firms begin to fail. The initial failure of IndyMac Bank, a large underwriter of subprime mortgage loans in 2007, received only modest notice. The larger collapse of Bear Sterns, a large Wall Street brokerage firm that owned significant amount of subprime mortgage debt in early 2008 shook up confidence in the financial markets. The fall 2008 failures of firms like Lehman Brothers and Washington Mutual was when full scale panic really began to set in.
Much work has been done since the Financial Crisis to improve the soundness of banks and other large financial firms across the globe, yet they are still a good early warning sign to watch if a new financial crisis begins to emerge. The prices of large global banks, particularly those that do much of their business in Europe have been declining ever since the European Central Bank moved to a negative interest rate policy in early 2015. The initial concern was from investors realizing that this new policy would make it harder for these banks to make money, yet the continued decline of the share prices in several of these important banks to levels that are even lower than they were at the depths of the financial crisis are not good, and are a sign of a weakened and less financially viable banking sector.
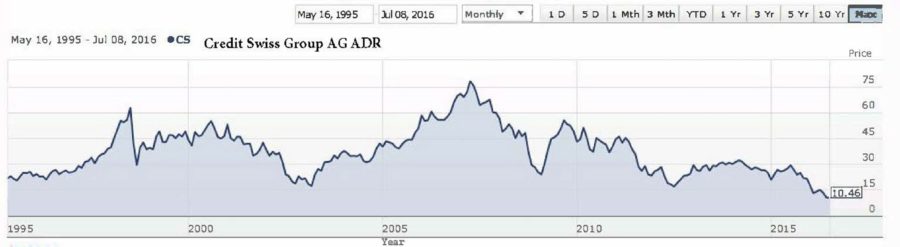
1)

2)
Economic Surprise Indexes
As was mentioned in the first page of this update, economic growth is expected to slow as a result of the U.K. voting to leave the European Union, and as a result economists will be revising down their economic expectations over the coming months and quarters. Whether future economic data comes in weaker or stronger than expected will be important in determining the accuracy of the estimated impact of an event which we have not seen before. One of the best ways to measure whether data is coming out better or worse than expected is to watch the Economic Surprise Indexes, which are put out by Citigroup. These indexes measure whether the data coming out on a regular basis is in line, stronger, or weaker than the consensus of economists expectations. The chart shown below, which tracks economic data coming out for Eurozone countries gives us a good example of what to look for. The zero line means that data is coming out in line with expectations, data above the zero line means that data is stronger than expected, and below zero means that it tends to be weaker. Note that the data tends to trends to cycle over time. If we see the data begin to trend significantly lower over the next few months we will take this as a warning sign that the economic impact has been underestimated and that larger problems could be ahead.
3)
Yield Spreads
Yields spreads measure the difference between low risk debt such as government bonds and higher risk debt such as non-investment grade corporate bonds. These changes in the yield spreads tend to be economically sensitive and tend to be a leading indicator of economic expansions and contractions. We had been seeing the spread widen up during the second half of 2014 through early 2016, and was driven to a large extent by weakness in energy prices negatively impacting the bonds of energy companies, which are the largest issuer of high yield corporate bonds. The yield spreads have narrowed and stabilized over the past few months. Continued stabilization on narrowing in these spreads would be good from an economic point of view. A renewed rise in the spreads would be an additional warning sign.
Adjustments to Weatherstone Investment Portfolios
In early June we either significantly reduced or eliminated exposure to foreign stocks, and also reduced exposure to domestic stocks as well, typically reducing equity exposure by 40-50%. This was due to measurable shifts in investor preferences for safe haven assets like bonds and gold relative to more risky assets such as stocks, as well as weakening in the number of foreign markets that have been participating in the stock market rebound over the past few months. In addition we have moved into the time of year when cash flows into the financial markets tend to slow down, as people turn their focus to summer vacations and other activities.
This reduced equity exposure helped to minimize volatility during the past couple of weeks. As markets have rebounded the short-term risk measurement models have remained somewhat defensive, so we have not made any significant increases to equity exposure. It is likely that we could see continued volatility as additional developments arise in both the Brexit aftermath, and the lead up to the Presidential elections this fall. If our risk measurement models turn positive, we stand ready to add additional equity exposure, and as foreign markets have become cheaper over the past few weeks, this should give us some good investment opportunities in the future, just as the weakness that we saw in energy stocks and high yield bonds in 2014 and 2016 has provided us with some nice buying opportunities in 2016.
Sources & Disclosure:
- 1) morningstar.com © 2016
- 2) morningstar.com © 2016
- 3) Ned Davis Research © 2016
Opinions expressed are not meant to provide legal, tax, or other professional advice or recommendations. All information has been prepared solely for informational purposes, and is not an offer to buy or sell, or a solicitation of an offer to buy or sell, any securities or instrument or to participate in any particular trading strategy. Investing involves risk, including the possible loss of principal. All opinions and views constitute our judgment as of the date of writing and are subject to change at any time without notice. The Dow Jones Industrial Average is a price-weighted average comprised of 30 significant stocks traded on the New York Stock Exchange and NASDAQ. The S&P 500 Index is an unmanaged market capitalization weighted price index composed of 500 widely held common stocks listed on the New York Stock Exchange, American Stock Exchange and Over-The-Counter market. The Dow Jones Transportation Average is a price-weighted average of 20 transport stocks in the United States. The Dow Jones Utility Average is the price-weighted average of 15 utility stocks traded in the United States. The S&P MidCap 400 Index is comprised of companies across different sector that are between $750 Million and $3 Billion in market capitalization. The S&P SmallCap 600 covers a wide range of small cap stocks, market capitalization that range from $400 Million to $1.8 Billion, and is weighted according to market capitalization. The S&P 500 Energy Sector is comprised of companies included in the S&P 500 that are classified as members of the GICS® energy sector. The MSCI World Index Ex US is a free-float adjusted market capitalization weighted index designed to measure market performance of developed markets that exclude the United States. The MSCI Emerging Markets Index is a free float-adjusted market capitalization index designed to measure equity market performance of 23 emerging market countries. Indexes are provided exclusively for comparison purposes only and to provide general information regarding financial markets and no investment can be made directly into an index. These indices or funds referenced in the article should not be used as a comparison of managed accounts or suitability of investor’s current investment strategies. If the reader has any question regarding suitability or applicability of any specific issue discussed above, he/she is encouraged to consult with their licensed investment professional. The value of the index varies with the aggregate value of the common equity of each of the 500 companies. The S&P 500 cannot be purchased directly by investors. This index represents asset types which are subject to risk, including loss of principal. Investors should consider the investment objectives, risks, charges and expenses of the underlying funds that make up the model portfolios carefully before investing. The ADV Part 2 document should be read carefully before investing. Please contact a licensed advisor working with Weatherstone to obtain a current copy. If the reader has any question regarding suitability or applicability of any specific issue discussed above, he/she is encouraged to consult with their licensed investment professional. Weatherstone Capital Management is an SEC Registered Investment Advisor with the U.S. Securities and Exchange Commission (SEC) under the Investment Advisers Act of 1940. Weatherstone Capital Management is not affiliated with any broker/dealer, and works with several broker/dealers to distribute its products and services. Past performance does not guarantee future results.


