With the S&P 500 stock index setting records on a daily basis, many market pundits continue to call for a long overdue correction in U.S. equity markets. According to a recent Wall Street Journal study, the Dow Jones Industrial Average (Dow) experiences a bull market correction on average every 12 months. The Dow is now up roughly 60% since its last correction in October of 2011 and is on its 32nd month since a pullback of 10% or more (1). The vast majority of the market pundits point to excess liquidity provided by central banks across the globe for this absence of a correction. Whether the pundits are right or wrong remains to be seen.
Equity investors continue to be enamored with central banks’ aggressive monetary policies across the globe. Most notable are the recent developments from the European Central Bank (ECB) which included rate cuts, negative deposit rates and outlined the roadmap for a possible asset purchase program similar to the Federal Reserve’s quantitative easing (QE) program. Data strongly suggests that QE triggers a shift from less risky assets such as bonds to riskier assets like equities. According to Bloomberg, the S&P 500 index rose 36% during the Fed’s first round of QE, 24% during the second round, and roughly 30% since the start of the latest round of QE (2). If this relationship continues and the ECB follows through with its asset purchase program, European equities could still have room to move higher. Over the course of the Fed’s three QE programs and the simultaneous increase in equity prices, pockets of the market did experience bubble-like behavior.
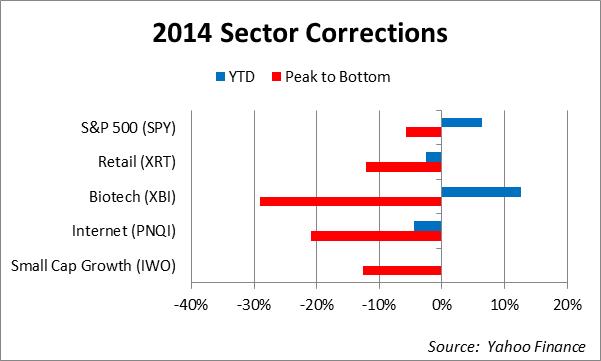
The primary culprits of the bubble-like behavior were in high momentum equity sectors which included Biotech, Retail, and Internet. According to a BofA Merrill Lynch report in the first quarter, the Biotech sector saw its price soar to a 60% premium to the S&P 500 on forward price to earnings (PE) basis. This is more than double of its historically trading range (3). Although these sectors saw their valuations skyrocket past their historical median, the market showed some rational thinking when these sectors all corrected during the 1st quarter of 2014. From the chart below, you can see that all of these sectors corrected by over 10% from their trading highs and the high flying biotech sector corrected by more than 30% from its high. From our standpoint, we saw these sector corrections as a healthy development for a market that many have come to question.
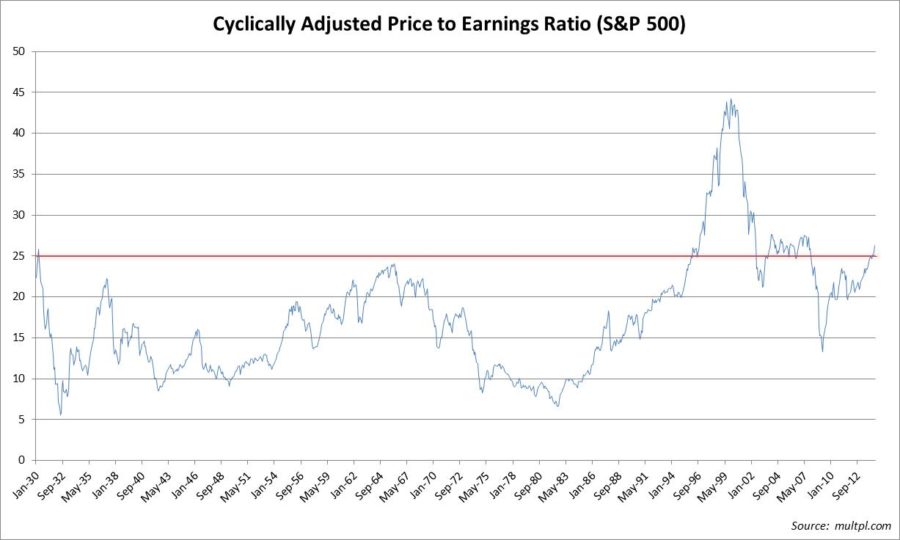
The broader based market is also moving into territory that is considered to be overvalued. The valuation level for the S&P 500 index has moved into the upper bound ranges based on historical measures. The chart below shows the Cyclically Adjusted Price to Earnings (CAPE) ratio of the S&P 500. It is a very popular valuation tool when trying to gauge how expensive the market is. It takes into account the current price of the S&P 500 relative to the moving average of the inflation adjusted prior 10 years’ earnings. You can see that since 1930, the CAPE ratio has exceeded 25 only three other times, two of which were during the dotcom and housing bubbles.
Tactical money management not only protects against broad market corrections by shifting to cash or by using tools to hedge the portfolio, but it can also be used to protect against large losses from individual holdings within the portfolio. As the sector correction chart showed above, even when the broad based indexes see only a modest retracement (S&P 500 from peak to bottom), individual sectors can see a correction if they become significantly overvalued. Even if an investor has a good pulse on the market, they can easily get blindsided if they are not paying close attention to the individual sectors that make up the market.
Over the course of early 2014, we shifted away from high momentum sectors such as small growth stocks within our core portfolio strategies. We were able to minimize damaging affects to the portfolio by reducing these areas as we saw valuations soar past their historical valuation levels. In a bull market such as the one we are currently in, there will almost always be pockets of the market that experience irrational behavior. Having a professional money manager that not only measures the risk of the overall market but for each market segment can be very valuable when trying to navigate through a bull market like the one we are currently in.
Luke Nagell
Investment Committee Member
(1) http://blogs.marketwatch.com/thetell/2014/06/09/is-a-stock-market-correction-overdue/
(2) http://www.bloomberg.com/news/2014-06-02/buy-with-central-banks-is-u-s-japan-lesson-for-ecb-qe-scenario.html
(3) http://www.bizfeedz.com/sp-500-relative-value-by-sector/
Disclosure: Opinions expressed are not meant to provide legal, tax, or other professional advice or recommendations. All information has been prepared solely for informational purposes, and is not an offer to buy or sell, or a solicitation of an offer to buy or sell, any securities or instrument or to participate in any particular trading strategy. Investing involves risk, including the possible loss of principal. All opinions and views constitute our judgment as of the date of writing and are subject to change at any time without notice. Investors should consider the investment objectives, risks, charges and expenses of the underlying funds that make up the model portfolios carefully before investing. The ADV Part II document should be read carefully before investing. Please contact a licensed advisor working with Weatherstone to obtain a current copy. The S&P 500 Index is an unmanaged market capitalization weighted price index composed of 500 widely held common stocks listed on the New York Stock Exchange, American Stock Exchange and Over-The-Counter market. Indexes are provided exclusively for comparison purposes only and to provide general information regarding financial markets. This should not be used as a comparison of managed accounts or suitability of investor’s current investment strategies. If the reader has any question regarding suitability or applicability of any specific issue discussed above, he/she is encouraged to consult with their licensed investment professional. The value of the index varies with the aggregate value of the common equity of each of the 500 companies. The S&P 500 cannot be purchased directly by investors. This index represents asset types which are subject to risk, including loss of principal. Weatherstone Capital Management is an SEC Registered Investment Advisor with the U.S. Securities and Exchange Commission (SEC) under the Investment Advisers Act of 1940. Weatherstone Capital Management is not affiliated with any broker/dealer, and works with several broker/dealers to distribute its products and services. Past performance does not guarantee future results.


