Is the Global Economic Slowdown in the Past?
The financial markets over the past six months, with the general increase in volatility, have led investors to feel like they are riding a rollercoaster. We had persistent declines in the fourth quarter of 2018, and then a strong rebound in stock prices during the first quarter of 2019. Many investors are questioning whether the worst is in the past, and if financial markets are back on more stable footing for the foreseeable future, or whether this is a rebound, in hopes for a resumption in synchronized global growth, that may be quickly reversed based on continuing global economic weakness. When examining stock prices alone, it would appear that the market environment is much healthier than the beginning of 2019, yet global economic data would say otherwise, making for a very mixed bag. In this commentary, we will explore both the positive and negative factors that have contributed to this renewed volatility, as well as what might lie ahead.
Positive – Accommodative Monetary Policies by The Federal Reserve and other Central Banks
As the stock market declined during the fourth quarter of 2018, The Federal Reserve continued to suggest that interest rate hikes into 2019 was probable, with two to three interest rate increases throughout the year. After the market decline began to pick up speed in late December of 2018, The Federal Reserve began to reverse course, stating that it would be more “patient” in its approach to increasing interest rates in 2019, which helped calm the financial markets, but also sparked the rally that has continued over the past few months. Throughout 2019 thus far, the tone of The Fed was conservative, and has become increasingly more conservative, estimating that it will not be hiking interest rates in 2019, resulting in more speculation by investors. Outside of the United States, Central Banks in China and Europe have grown more accommodative in their monetary policies over the past several months as well. With economic weakness being more pronounced outside of the U.S., these moves by foreign Central Banks will probably have a more significant impact on global growth than moves by The Federal Reserve alone.
Negative – Inversion of the Yield Curve
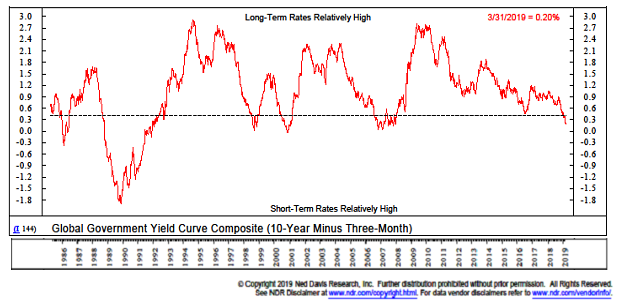
When plotting various durations of bonds on a graph, one can see an upward sloping curve formed by the dots, relative to the yield received for each duration of bond. An inverted yield curve occurs when long-term interest rates fall lower than short-term interest rates. This typically occurs either because investors expect that interest rates are going to decline in the future, typically due to economic weakness, or an expected significant slowdown in inflation. Despite optimism pushing the prices of stocks higher in 2019, the yields on bonds have been declining, and yield curves around the world are beginning to invert. As the chart below illustrates, the difference between yields on short-term vs. long-term government bonds have narrowed to levels that have been associated with important historic recessions, such as 2007-2008, the early 2000’s and the early 1990’s. The narrowing of yield spreads is also significant, because over the past 30 years, when the yield spread ratio has been below the dashed line, global stocks have struggled to produce positive returns, advancing at an annualized rate of only 1.3% per year.
Positive – Global Purchasing Managers Indexes Stabilization
Although the yield curve is beginning to invert or flatten in numerous countries, we are seeing some signs of potential stabilization in data from the JP Morgan Global Purchasing Managers Indexes. The most recent reading through the end of March indicated that the index stabilized at a reading of 50.6, after declining for ten consecutive months. A reading below 50 on the index indicates a contraction in manufacturing, which has the tendency to be correlated to economic recessions. In March, there was improvement in China’s index, which saw a rebound to above 50, after being in contraction mode for the prior three months. Several emerging markets also exhibited good strength through the end of the month. In addition, a component called the Future Output Index jumped by nearly one point, indicating that plans for future orders by businesses was picking up. The fact that the Purchasing Managers Indexes tend to turn more positive approximately four months before the global economy does could be signaling that the worst of the slowdown may be behind us.
Negative – Broad-based Global and U.S. Economic Data Increasingly Missing Estimates
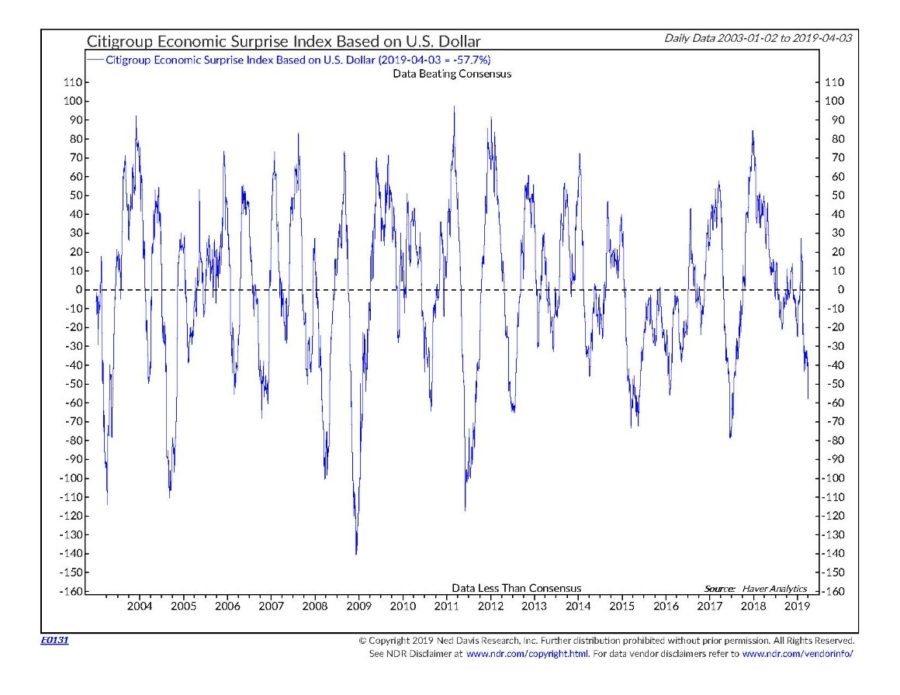
When looking at broad-based measures of both global U.S. economic data, and whether it is being reported as stronger or weaker than expected through such indexes as the Citigroup Economic Surprise Indexes, there has not been a significant upturn, and in fact, what is being reported recently has been coming in weaker than expected even more frequently than it did in the fall of 2018, when stocks were dropping rapidly. The chart below shows the current reading from the U.S. Economic Surprise Index, which measures whether reported economic data is coming in stronger or weaker than average estimates by economists. As the chart below shows, there has been a continued deterioration in actual economic data vs. expectations, and it is not specific to just the United States.
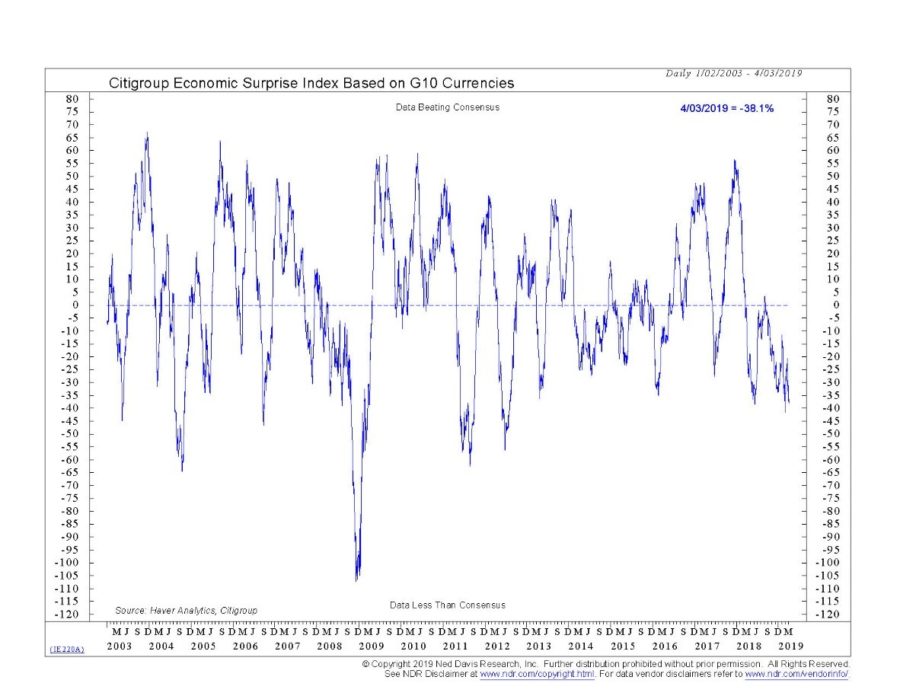
The second chart shows the Economic Surprise Index for the 10 largest economies in the world, indicating the extent of the weakness. When readings of these measures have been as weak as they are currently, stocks have historically struggled. Over the past 15 years for which there is data, developed market stocks have declined at an annualized rate of -1.96% when the data has been this weak.
Summary
Stocks have been advancing as if the pause in interest rate hikes by The Federal Reserve assures investors that the economic slowdown may only be temporary. The continued weakness in economic data for both the U.S. and around the world, as well as inversions of various yield curves in numerous countries around the world, is not indicating any significant signs of an economic turnaround. This equates to high-risk environment for the financial markets, similar to last fall: stocks had been moving higher for several months throughout the summer, while global growth was weakening, but then quickly gave back all of their gains once investors began to realize that the U.S. would not be able to avoid a global economic slowdown.
If weak economic growth persists, investors may be quick to revert back to increased concerns of a global economic slowdown, which The Federal Reserve may not be able to combat simply by pausing its interest rate hikes, leading to an evaporation of the stock market gains obtained over the recent months. As a result, we have cautiously positioned the model portfolios to benefit if stocks continue to rise, but we are prepared to quickly reduce exposure if the market weakness resumes.
Michael Ball, CFP®
Lead Portfolio Manager
Opinions expressed are not meant to provide legal, tax, or other professional advice or recommendations. All information has been prepared solely for informational purposes, and is not an offer to buy or sell, or a solicitation of an offer to buy or sell, any securities or instrument or to participate in any particular trading strategy. Investing involves risk, including the possible loss of principal. All opinions and views constitute our judgment as of the date of writing and are subject to change at any time without notice. The Dow Jones Industrial Average is a price-weighted average comprised of 30 significant stocks traded on the New York Stock Exchange and NASDAQ. The S&P 500 Index is an unmanaged market capitalization weighted price index composed of 500 widely held common stocks listed on the New York Stock Exchange, American Stock Exchange and Over-The-Counter market. Indexes are provided exclusively for comparison purposes only and to provide general information regarding financial markets and no investment can be made directly into an index. These indices or funds referenced in the article should not be used as a comparison of managed accounts or suitability of investor’s current investment strategies. The value of the index varies with the aggregate value of the common equity of each of the 500 companies. The S&P 500 cannot be purchased directly by investors. This index represents asset types which are subject to risk, including loss of principal. Investors should consider the investment objectives, risks, charges and expenses of the underlying funds that make up the model portfolios carefully before investing. The ADV Part 2 document should be read carefully before investing. Please contact a licensed advisor working with Weatherstone to obtain a current copy. If the reader has any question regarding suitability or applicability of any specific issue discussed above, he/she is encouraged to consult with their licensed investment professional. Weatherstone Capital Management is an SEC Registered Investment Advisor with the U.S. Securities and Exchange Commission (SEC) under the Investment Advisers Act of 1940. Weatherstone Capital Management is not affiliated with any broker/dealer and works with several broker/dealers to distribute its products and services. Past performance does not guarantee future results.


