Risks and Opportunities in 2017
2017 is going to be an interesting year. After an eventful 2016, and confidence in the predictability of polling all but eliminated by the surprise outcomes in both the U.S. Presidential election and the United Kingdom’s referendum on staying in the European Union, we are probably all wondering what the major surprises will be in 2017. In this quarterly update I am not going to try and predict what will happen over the coming year, but I will discuss some of the important areas to monitor and how we plan to manage risks. In an attempt to provide some context to the year we will take a deeper dive into three key areas:
Global economic growth.
High valuations for U.S. stocks.
Rising interest rates.
Global Economic Growth
In each of the last two updates we spent time covering the state of the global economy, as it appeared that the steady deterioration of economic growth was beginning to stabilize and turn more positive. The trend in global economic growth is important to investors because of its impact on corporate earnings, inflation levels, interest rates and a host of other important measures, including government budget deficits and political and economic unrest.
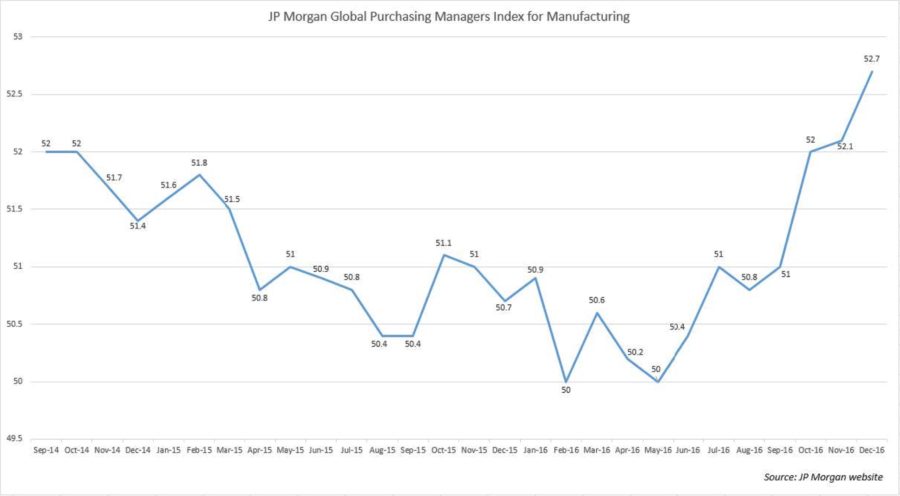
One of the leading economic measures that we have discussed in the past is the Global Purchasing Managers Index, which is put together and published monthly by JP Morgan. A reading above 50 indicates expansion in the manufacturing sector, and the higher the number is above 50, the stronger the growth. A number below 50 indicates that manufacturing is contracting, and has historically been consistent with a global recession. The index has been trending steadily downward since early 2014, and dropped to a reading of 50 twice during the first half of 2016. Since that time it has begun a steadily climb and ended the year at a reading of 52.7[1], the highest level since February 2014.

New orders, a separate measuring tool, and leading indicator of future output, has risen four consecutive months, the longest streak since January of 2013. In addition, new orders have outpaced inventory growth in a very robust 85% of the countries in the survey[2].
Stronger economic growth should be favorable for corporate earnings, which have been declining for most of the past two years. Earnings growth could help to push stock prices higher. Justification for stock market growth without significant earnings growth has been difficult due to high valuations, which we will discuss in greater detail in the pages to come.
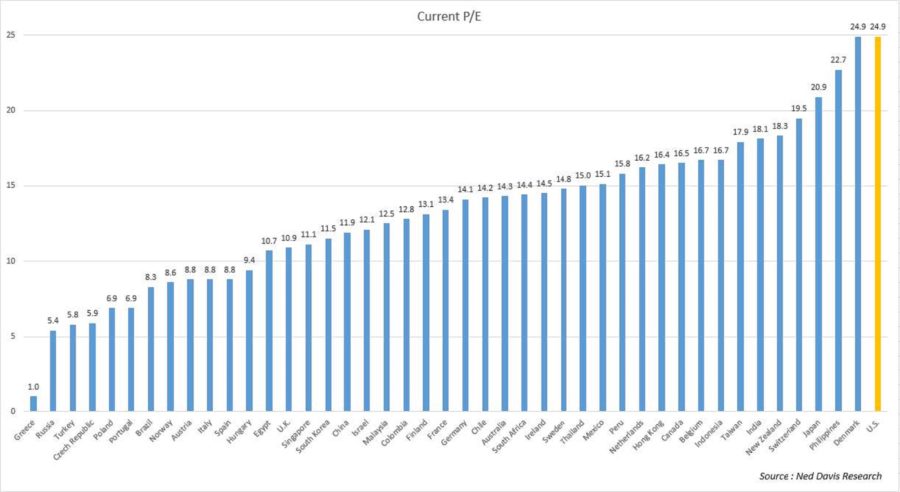
In addition, stronger global growth could be quite beneficial for the performance of foreign stocks relative to domestic stocks, which have underperformed for 6 of the past 7 years. To graphically see the difference, the table below shows a ranking of most of the stock markets around the world ranked from cheapest to most expensive, based upon the cyclically adjusted price to earnings ratio[3]. This is one of the better valuations measures because it allows us to normalize and compare data back to the late 1800s. Robert Shiller of Yale University, won a Noble Prize for his work developing the ratio. As shown in the chart below, the U.S. is tied with Denmark for being the most expensive stock market in the world based upon this measure, and shows that foreign markets are quite attractive.

I would also like to briefly comment on European bank stocks, one of the areas we felt might signal a renewed round of weakness in the global economy. Over the last several months, dating back our previous two quarterly commentaries, we were concerned that if their stock prices continued to decline further global weakness may ensue. From the end of the 3rd quarter through 1/4/17, the prices of the bank stocks we were monitoring have all risen by 20% or more, another positive sign for the global economy.
High Valuations for U.S. Stocks
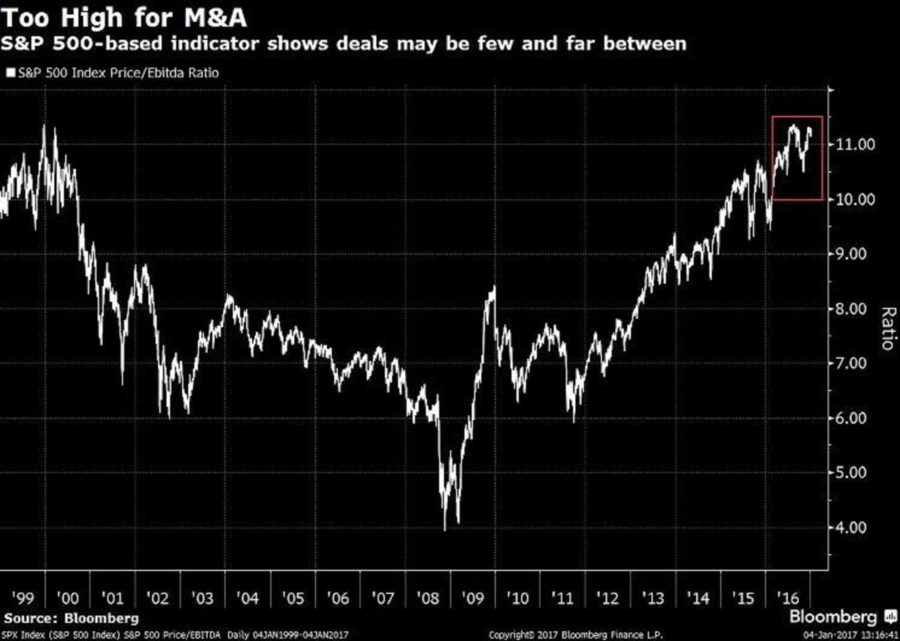
One of the challenges that we have talked about for U.S. stocks for quite some time is the high valuation levels at which they trade, and the fact that historically either strong economic and earnings growth or a stock reversal would be required to justify stock prices. Usually it is the stock reversal that tends to happen. We discussed in the prior section that improving global economic growth should translate into stronger earnings for companies. Many times in the past this has also been a driver for mergers and acquisitions, which can be a further catalyst to propel stock prices higher. With valuations in the current range this M&A activity is difficult to achieve, as seen in the chart below. The chart shows data on the price of stocks in the S&P 500 index valued using price divided by company earnings before the impact of interest, taxes, depreciation, and amortization. Stocks are near their historically high levels of the late 1990’s, and at these levels there are likely to be few candidates that make attractive merger targets for most companies. We have discussed the challenges of high valuations in the past, and expect to continue to discuss these challenges in future commentaries. Suffice it to say that this remains one of the strongest headwinds for U.S. stocks.

Rising Interest Rates
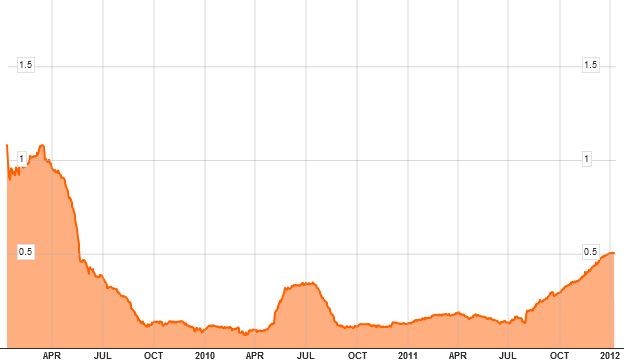
For the first half of 2016 global interest rates steadily moved lower, indicating that global economic growth remained weak, and that Central Banks from around the world were prepared to use bond buying programs and even negative interest rates in an effort to stimulate economic growth. The yield on a 10 year U.S. Government bond started the year at 2.27%, and dropped as low as 1.38%, on July 6th before drifting higher during the late summer and early fall. By the time the election rolled around the yield had moved up to 1.86%[4].
With the unexpected win by Donald Trump and expectations for extensive infrastructure spending and other policy changes designed to increase economic growth, interest rates moved significantly higher in November and December, with the yield on a 10 year U.S. Government bond moving to 2.45% at the end of the year. Global bond yields also moved higher, with German 10 year bonds moving from a negative yield of -.11% in early July to .20% at the end of the year, and Japanese 10 year bonds moving from a negative yield of -.26% in early July to .04% at the end of the year[5].
This increase in yields on bonds around the world has caused significant losses to bond investors, as bond prices move in the opposite direction of interest rates. November was particularly tough, with the Barclays Global Aggregate Total Return Index dropping by 4%, its worst showing since the gauges inception in 1990. As a means of quantifying the impact, the estimated global bond market losses during the months of October and November totaled $2.8 trillion dollars according to Bloomberg[6].
We were pleased that the turmoil in the bond market did not have much of an impact on our bond heavy income portfolios due to our heavy weighting to high yield corporate bonds. Typically high yield corporate bonds are more economically sensitive, and generally benefit from the expectations for stronger economic growth. Two of our three income programs posted positive returns for the third quarter, and the one that posted a loss, was down by less than .5%. All three strategies posted respectable returns for the year.
Managing risks in 2017
It is quite nice when the financial markets enhance our wealth, but there are also times when markets can drop significantly and erode the wealth that we have spent a significant amount of time building. We are all used to stock market risk, because it is a traditionally volatile asset class. We don’t typically think of bonds as being a very volatile asset class, primarily because interest rates have been trending lower for nearly 35 years. If that trend begins to reverse and we move back to a period of generally rising interest rates, such as we saw in the 1960’s and 1970’s, many investors may be surprised with the size of losses that they may see in a typical passive bond portion of their investment portfolio.
If we need to become more defensive during the coming year because of rising interest rates, our tactical flexibility can serve us well because we have the ability to move 100% to money market funds. When interest rates move higher, money market interest rates quickly follow suit and they provide good stability of principal. We can also use floating rate bonds funds which may benefit during a rising interest rate environment. We will continue to monitor regularly and adjust as needed.
In the stock market, two of the most probable risks that we see are that with global growth beginning to accelerate, foreign stocks may begin to significantly outperform U.S. stocks, or that we may see a severe correction or bear market. In the first instance, some of the risk measurement models that we utilize look at the potential risk and return for both foreign and domestic stock markets. If we begin to see the expected returns for foreign stocks looking better than for those in the United States, some of our growth investment strategies such as Focused Growth and Diversified Growth will have the ability to allocate a significant amount of their portfolio into foreign equities. In years past these models have had 50% or more invested outside of the United States. If it looks like this is becoming a persistent trend we will notify you in future commentaries and would recommend you meet with your advisor to evaluate the risks and rewards of other international equity strategies.
If we see this very old bull market run out of steam in 2017, and both domestic and foreign stocks fall, the flexibility of our investment portfolios to move to bonds or cash may minimize the impact of the decline. We saw how this worked during the end of 2015 and early 2016, when stocks declined nearly 15%, yet the flexibility of our tactical equity programs helped us to keep the declines in virtually all of the portfolio to less than half of what was experienced by the indexes. The goal of our tactical investment strategies is to measure the amount of potential risk and reward, and to move from riskier asset classes into safer ones such as money market and bond funds when protection is needed. We update our risk measurement models on both a weekly and monthly basis to help us quickly adapt to changing market environments. This process has served us well through the two major stock market declines of the past 20 years, and we believe it is still beneficial today.
We hope that you have a great year in 2017, and appreciate the trust and confidence that you have placed in us.
Sincerely,
Michael Ball
Lead Portfolio Manager
Sources and Disclosure:
[1]JP Morgan website
[2] Haver Analytics
[3] Ned Davis Research
[4] Yahoo Finance
[5] Yahoo Finance
[6] https://www.bloomberg.com/news/articles/2016-12-01/global-bonds-suffer-worst-ever-meltdown-as-bull-market-shows-age
Opinions expressed are not meant to provide legal, tax, or other professional advice or recommendations. All information has been prepared solely for informational purposes, and is not an offer to buy or sell, or a solicitation of an offer to buy or sell, any securities or instrument or to participate in any particular trading strategy. Investing involves risk, including the possible loss of principal. All opinions and views constitute our judgment as of the date of writing and are subject to change at any time without notice. The Dow Jones Industrial Average is a price-weighted average comprised of 30 significant stocks traded on the New York Stock Exchange and NASDAQ. The S&P 500 Index is an unmanaged market capitalization weighted price index composed of 500 widely held common stocks listed on the New York Stock Exchange, American Stock Exchange and Over-The-Counter market. The Dow Jones Transportation Average is a price-weighted average of 20 transport stocks in the United States. The Dow Jones Utility Average is the price-weighted average of 15 utility stocks traded in the United States. The S&P MidCap 400 Index is comprised of companies across different sector that are between $750 Million and $3 Billion in market capitalization. The S&P SmallCap 600 covers a wide range of small cap stocks, market capitalization that range from $400 Million to $1.8 Billion, and is weighted according to market capitalization. The S&P 500 Energy Sector is comprised of companies included in the S&P 500 that are classified as members of the GICS® energy sector. The MSCI World Index Ex US is a free-float adjusted market capitalization weighted index designed to measure market performance of developed markets that exclude the United States. The MSCI Emerging Markets Index is a free float-adjusted market capitalization index designed to measure equity market performance of 23 emerging market countries. Indexes are provided exclusively for comparison purposes only and to provide general information regarding financial markets and no investment can be made directly into an index. These indices or funds referenced in the article should not be used as a comparison of managed accounts or suitability of investor’s current investment strategies. If the reader has any question regarding suitability or applicability of any specific issue discussed above, he/she is encouraged to consult with their licensed investment professional. The value of the index varies with the aggregate value of the common equity of each of the 500 companies. The S&P 500 cannot be purchased directly by investors. This index represents asset types which are subject to risk, including loss of principal. Investors should consider the investment objectives, risks, charges and expenses of the underlying funds that make up the model portfolios carefully before investing. The ADV Part 2 document should be read carefully before investing. Please contact a licensed advisor working with Weatherstone to obtain a current copy. If the reader has any question regarding suitability or applicability of any specific issue discussed above, he/she is encouraged to consult with their licensed investment professional. Weatherstone Capital Management is an SEC Registered Investment Advisor with the U.S. Securities and Exchange Commission (SEC) under the Investment Advisers Act of 1940. Weatherstone Capital Management is not affiliated with any broker/dealer, and works with several broker/dealers to distribute its products and services. Past performance does not guarantee future results.


