- Three important factors likely to impact the stock market over the next 2 to 3 years
- A look at economic and stock market valuations
- A historical perspective of stock market returns for the month of January
2013 was a surprisingly good year for U.S. equity investors, and many investors are wondering if the positive returns will continue through 2014. I will say at the outset that predicting the likely return of the stock market has been more difficult than normal over the past few years, as the exceptionally low interest rates and non-standard programs such as the various Quantitative Easing programs have impacted the way many asset classes have been priced relative to the underlying economic fundamentals. For those interested in a more detailed discussion on those impacts, please see our July 2013 commentary.
In this commentary I will discuss three important factors that are likely to impact stocks over the next 2-3 years and how that influences the current risk profile. The first area will be the economy, the second area will be stock market valuation, and the third will be the historical context of this January providing a negative return for stocks.
The economy was a concern as we came into 2013 when the domestic economic growth was slowing and Europe had slipped back into a recession. In 2013, economic growth began to pick up in the second half of the year and Europe emerged from recession during the third quarter, although domestic economic growth was slower in 2013 than in 2012 with the economy growing at 1.9% in 2013 vs. 2.8% in 2012 (1). The emergence of Europe from recession and more broad-based growth globally is important because the worst bear markets have come when the economy has gone into a recession. Improved economic growth is a positive for the stock market.
The second factor is valuation, both domestically and globally. This is much more of a mixed picture. Domestically, stocks have become increasingly expensive, as the prices of stocks have gone up much more rapidly than corporate earnings over the past few years. We still have earnings coming in from 2013, but the estimated earnings growth for the stocks making up the S&P 500 is in the 4-5% range (2), so when you look at the return for the S&P 500 in 2013, about 15-20% of the return can be attributed to the earnings growth of the underlying companies and approximately 80-85% of the return comes from investors being willing to pay more for that dollars’ worth of earnings.
For Domestic stocks, if we look back historically with data from the 1920’s up to 2013 and look at the current price divided by the average earnings over the past five years, we have moved into the most expensive quintile. Historically when stocks have been at that valuation level, the annualized growth rate has been about 4.1%, which is below average. In addition, if we look at the valuation of U.S. stocks relative to the rest of the world, we are one of the most expensive countries as measured by 10 year cyclically-adjusted price earnings ratios. Last year we were the sixth most expensive country in the world.
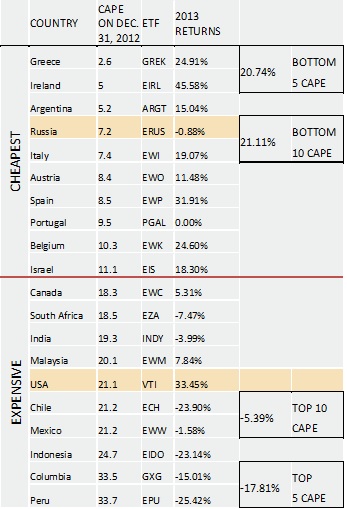
The chart to the right shows how the ten most expensive and ten least expensive countries in the world fared last year, and the ten cheapest markets outperformed the ten most expensive markets by an average of more than 25% for the year. Although this relationship does not repeat every year, there is a measurable difference over time between the performance of the cheapest markets relative to the most expensive. With the performance of the U.S. being strikingly more positive than most of the other most expensive markets, one has to wonder if it can continue. As we enter 2014, the U.S. is now ranked as the second most expensive market in the world. While this does not guarantee a subpar year, it does become an increasing headwind.
The other important message in looking at global valuations is that if you are looking to buy things at cheaper valuations, then the place to look is of outside the United States. Performance of international markets has lagged our domestic market for the past few years, so buying the cheaper markets has not been rewarded, in fact the performance difference between our stock market and the average emerging markets (which actually lost about 4% last year) was the widest since the Asian Currency Crisis back in 1998. If global economic growth can continue to improve, then there could be strong relative performance from international markets in the coming years, as valuations in foreign markets moves closed to those of the U.S.
The third factor relates to an interesting seasonal tendency. January is historically an interesting month because it seems to have an uncanny ability to set the tone for the remaining 11 months of the year. With January typically being a positive month for stocks, it is noteworthy when stocks are down in January, particularly when it has been preceded by a positive year. Looking back over the past 60 years, there have been 17 times when there has been a positive year followed by a negative January, the median return over the following 11 months was a -5.3% return. While the percentage of time that the next 11 months were negative was not overly high at 53%, the more important message is that the negative January is important to consider because it implies a loss of upside momentum in the market.
In summary, the fact that stocks have moved into historically overvalued territory will be an important headwind for our stock market both in terms of absolute returns and relative to foreign markets over the coming years. An extended market advance without a 20% correction and a recent loss of upward momentum during a historically positive January signals that a more significant correction could be in the wings, particularly if the end of the Federal Reserve’s Quantitive Easing program does not go smoothly. However, with global economic growth modestly improving, it would suggest that if we experience a bear market decline that it will be shallower than normal, probably around 20% or less. Several of our stock market models have moved from positive to negative and resulting in significant increases to cash an bonds within our equity portfolios. Whether this is just a short-term correction or the start of an overdue 15-20% correction will depend heavily on cash flows into the stock market, and we are watching that closely. We will continue to monitor and make adjustments to asset allocations as necessary.
Michael Ball
Lead Portfolio Manager
(1) Bureau of Economic Analysis (2) Barrons.com; 2014 earnings outlook
Disclosure: Opinions expressed are not meant to provide legal, tax, or other professional advice or recommendations. All information has been prepared solely for informational purposes, and is not an offer to buy or sell, or a solicitation of an offer to buy or sell, any securities or instrument or to participate in any particular trading strategy. Investing involves risk, including the possible loss of principal. All opinions and views constitute our judgment as of the date of writing and are subject to change at any time without notice. Investors should consider the investment objectives, risks, charges and expenses of the underlying funds that make up the model portfolios carefully before investing. The ADV Part II document should be read carefully before investing. Please contact a licensed advisor working with Weatherstone to obtain a current copy. The S&P 500 Index is an unmanaged market capitalization weighted price index composed of 500 widely held common stocks listed on the New York Stock Exchange, American Stock Exchange and Over-The-Counter market. Indexes are provided exclusively for comparison purposes only and to provide general information regarding financial markets. This should not be used as a comparison of managed accounts or suitability of investor’s current investment strategies. If the reader has any question regarding suitability or applicability of any specific issue discussed above, he/she is encouraged to consult with their licensed investment professional. The value of the index varies with the aggregate value of the common equity of each of the 500 companies. The S&P 500 cannot be purchased directly by investors. This index represents asset types which are subject to risk, including loss of principal. Weatherstone Capital Management is an SEC Registered Investment Advisor with the U.S. Securities and Exchange Commission (SEC) under the Investment Advisers Act of 1940. Weatherstone Capital Management is not affiliated with any broker/dealer, and works with several broker/dealers to distribute its products and services. Past performance does not guarantee future results.


