The First Quarter Was a Wild Ride
Just over five weeks into the new year, the Dow Jones Industrial Average had lost nearly 1,800 points for the year and the index was off to its worst start ever. Shortly thereafter, two major oil producing, Saudi Arabia and Russia, signaled that they were open to a production freeze to help stabilize oil prices, and Jamie Dimon, the CEO of JP Morgan signaled a vote of confidence in his bank, and by inference to the banking industry in general by using his own cash to buy 500,000 shares of stock in the bank that he runs. These two catalysts helped stock prices rebounded sharply.
These events, along with a stabilization in the Chinese currency and a modest improvement in domestic economic data, helped pull stock markets indices back from double-digit declines to end the quarter with modest gains or losses. Will the recent improvement last, or is this just a bear market rally in an environment where stocks have not been able to make any headway over the past year?
The Positives
Oil prices – The stabilization in oil prices is a big positive. While low oil prices typically benefit consumers, too much weakness can cause a wave of bankruptcies in the industry, and put pressure on banks who have made loans to companies in the industry. These extremely low prices may often cause heavy oil producing countries to face social unrest at home. As oil prices bottomed in February and began to move higher, the stock market moved up in near lock step. The end of the price decline, even if only temporarily, given the fickle nature of agreements between and among OPEC countries, gave investors hope that this potentially problematic situation would minimize a potential wave of defaults.
While it may seem counterintuitive that too sharp a decline in oil prices could be a bad thing for the economy, consider the similarities to what happened with technology and telecom companies when over investment in the late 1990’s and a subsequent lack of profitability to maintain corporate viability led to a significant layoffs and defaulted loans. With the technology decline the economy was weakened and pushed us into recession in early 2001. Similarly the 2007-2009 recession was due in large part to the popping of the housing bubble, which followed a number of years of very strong price increases in home prices, making it difficult for many American’s to afford a home. The decline in home prices did serve to bring housing back to more affordable levels, but the depth and broad-based nature of the decline, beyond anything we had seen in the past century, led to the most significant recession in our lifetimes thus far. So, while oil price declines are often a good thing, too much of a good thing can become a bad thing because of the ripple effects it may create.
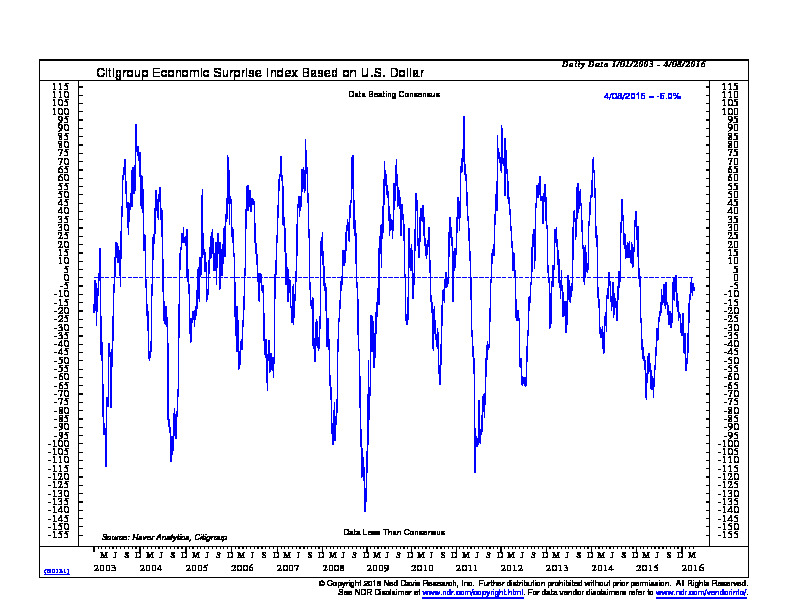
Economic stabilization – Over the past several weeks we have also seen a modest improvement in the economic data being reported. One of the easiest ways to measure whether the trend of economic data has been stronger or weaker than normal is through the Citigroup U.S. Economic Surprise Index, which is shown below. The chart measures the economic data that comes out each day vs. the consensus of what economist’s expect that the data will be. If it is above expectations, it is a positive number, if it is below expectations, it is a negative number. If all economic data were to come out in line with expectations, it would be at zero. The chart tells us that over the past several months we have been seeing weaker than expected economic data, but over the past few weeks, the data, although still weaker than expected is not as weak as it had been, and is closer to consensus expectations. A continued improvement in this trend and data stronger than estimates, could be crucial in keeping the rally going.
The Negatives
Earnings – We have been in an earnings recession for a year. With the current expected decline for Q1 2016 earnings for the S&P 500 of -9.1%, it will be the first time that we have had four consecutive quarters of negative earnings growth since Q4 2008 through Q3 2009, according to Factset Earnings Insight. In an environment of declining earnings, it is difficult for many investors to be motivated to want to increase their exposure to stocks. We have written about the challenge of declining earnings in prior commentaries, so we won’t expand on it further, but earnings are still moving in the wrong direction.
Negative interest rates – Negative interest rates are being used by various central banks in an effort to stimulate bank lending and economic growth by charging banks to hold money in reserves at the Central Bank if they are not lending it out. In late January, Japan joined several other European Central Banks in moving to a negative interest rate policy. Although this can be seen as a positive for stocks because it further reduces competition from bonds, I believe that in the bigger picture it is a negative in two respects. First, it indicates that the economic environment in the areas where these policies are being implemented is deteriorating rather than getting better. Second, by forcing rates to near zero levels, you begin to reach a point where individuals and banks decide that the potential benefit of a low interest rate when making a loan is not worth the potential loss if a loan goes bad. As a result, one of the basic rules of capitalism regarding risk and reward is breaking down and it hurts the overall economic functioning in these economies.
Banks – A fallout from negative interest rate policies and weakness in the energy sector is the European banking sector. With increasing pressure on net interest margins because of Central Bank policies, and the prospect of increasing default rates, we are seeing the prices of some of the world’s largest banks dropping below their lows of the 2007-2009 Financial Crisis, and have been cutting or eliminating their dividends over the past few months. Notable banks seeing these declines include Barclays, which cut its dividend, Deutsche Bank, which eliminated its dividend back in October, as well as Santander and Standard Chartered, which cut their dividends last year. These dividend cuts and share prices have dropped to levels last seen during the last Financial Crisis and are signs of a worsening economic environment rather than an improving one.
Bright Spots & Possible Opportunities
Foreign stocks – While we remain in a challenging environment, we do have areas that have good potential for future growth. Areas such as foreign stocks continue to show very attractive valuation levels relative to our stock market, and once we begin to see improvement in the global economic picture, we could see some significant long-term outperformance from that area of the market. We don’t believe it is time to move into this area on a broad basis yet due to economic concerns, and foreign stocks under-performed U.S. stocks in the first quarter by nearly eight percentage points.
High yield bonds – The high yield bond market began to turn around during the first quarter after more than two years of subpar performance due to the slowing global economy, talk of Federal Reserve interest rate increases and falling energy prices, as energy companies currently make up the largest sector of the high yield bond market. The catalyst for the turnaround in this segment of the market was the improvement of oil prices and the prospect that bankruptcies and debt restructuring would be lower than expected, and with yields at levels not seen since the European debt crisis of 2011, bargain hunting began, and prices began to rise. We were buyers of high yield bonds beginning in late February, and with many of the funds yielding over 7% we are enjoying both the above-average yields and some capital appreciation as oil prices have continued to remain stable. It remains to be seen if this will become a long-term position and it will depend heavily upon whether economic growth begins to pick up, but it does illustrate that we are able to find some good investment opportunities in this environment.
Summary
The global economy is still facing headwinds from sub-par economic growth and slowing corporate earnings and the banking system is showing signs of significant stress from negative interest rate policies in some areas of the world. Yet, a rebound in oil prices has at least temporarily taken one significant concern off of the table, and has provided us with a window of opportunity to purchase beaten down assets that can benefit from stable or rising oil prices. There are pockets of good value in the markets, but they are likely to require patience and a willingness to tolerate above-average short term volatility. It is also important to recognize that they may only be attractive investments for a few months at a time, because global concerns still seem to be weighing heavily on markets.
Michael Ball
Portfolio Manager
For more information on specific strategies or any other information, please contact Ryan Connolly at rconnolly@weatherstonecm.com or at 720-407-4311.
Sources & Disclosure:
- Ned Davis Research © 2016
Opinions expressed are not meant to provide legal, tax, or other professional advice or recommendations. All information has been prepared solely for informational purposes, and is not an offer to buy or sell, or a solicitation of an offer to buy or sell, any securities or instrument or to participate in any particular trading strategy. Investing involves risk, including the possible loss of principal. All opinions and views constitute our judgment as of the date of writing and are subject to change at any time without notice. The Dow Jones Industrial Average is a price-weighted average comprised of 30 significant stocks traded on the New York Stock Exchange and NASDAQ. The S&P 500 Index is an unmanaged market capitalization weighted price index composed of 500 widely held common stocks listed on the New York Stock Exchange, American Stock Exchange and Over-The-Counter market. The Dow Jones Transportation Average is a price-weighted average of 20 transport stocks in the United States. The Dow Jones Utility Average is the price-weighted average of 15 utility stocks traded in the United States. The S&P MidCap 400 Index is comprised of companies across different sector that are between $750 Million and $3 Billion in market capitalization. The S&P SmallCap 600 covers a wide range of small cap stocks, market capitalization that range from $400 Million to $1.8 Billion, and is weighted according to market capitalization. The S&P 500 Energy Sector is comprised of companies included in the S&P 500 that are classified as members of the GICS® energy sector. The MSCI World Index Ex US is a free-float adjusted market capitalization weighted index designed to measure market performance of developed markets that exclude the United States. The MSCI Emerging Markets Index is a free float-adjusted market capitalization index designed to measure equity market performance of 23 emerging market countries. Indexes are provided exclusively for comparison purposes only and to provide general information regarding financial markets and no investment can be made directly into an index. These indices or funds referenced in the article should not be used as a comparison of managed accounts or suitability of investor’s current investment strategies. If the reader has any question regarding suitability or applicability of any specific issue discussed above, he/she is encouraged to consult with their licensed investment professional. The value of the index varies with the aggregate value of the common equity of each of the 500 companies. The S&P 500 cannot be purchased directly by investors. This index represents asset types which are subject to risk, including loss of principal. Investors should consider the investment objectives, risks, charges and expenses of the underlying funds that make up the model portfolios carefully before investing. The ADV Part 2 document should be read carefully before investing. Please contact a licensed advisor working with Weatherstone to obtain a current copy. If the reader has any question regarding suitability or applicability of any specific issue discussed above, he/she is encouraged to consult with their licensed investment professional. Weatherstone Capital Management is an SEC Registered Investment Advisor with the U.S. Securities and Exchange Commission (SEC) under the Investment Advisers Act of 1940. Weatherstone Capital Management is not affiliated with any broker/dealer, and works with several broker/dealers to distribute its products and services. Past performance does not guarantee future results.


