Living in Denver at about one mile above sea level, we hear a lot about the thin air. There are advantages and disadvantages to this. People love to play golf and baseball up here because the ball goes further. Hikers and skiers coming up from lower elevations can sometimes get altitude sickness, particularly if they have not researched and taken precautions for what they need to do when coming up from low elevations and are getting out on mountains that are over two miles above sea level. Comparatively, my reason for talking about the impact of high elevations is that high valuation levels in financial markets can also cause investments to begin to behave differently than they often do at lower valuation levels. And while valuation does not typically make a significant difference to investment performance over the short run, it frequently does make a sizeable difference over multi-year periods.
In this issue, we will look at prior periods in history which also experienced similar high valuation levels. We will also explore what we believe to be the primary driver of the current valuations, and highlight what can be done to minimize the potential negative impact of high valuations. The chart below shows stock market valuation for the U.S. based upon an average of several indicators that have each been around for nearly 100 years. Brackets have been placed on the chart to show the levels at which the stock market has either been historically expensive or cheap by these measures, and the subsequent returns over various time periods.
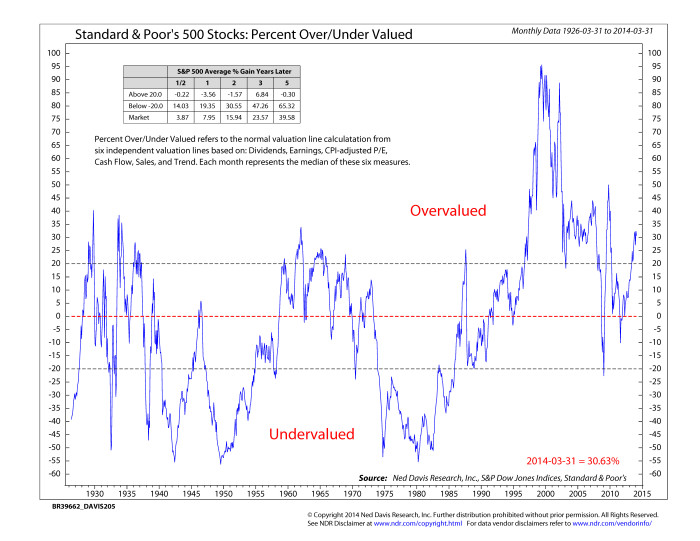
As the chart shows, we have moved back into the overvalued level as investors have driven up the price which they are willing to pay for stocks, faster than the underlying fundamentals of the stocks themselves have improved. The table in the upper left corner shows the average performance for the S&P 500 over several different time frames. It is important to note that there has historically been little or no return when investors have held stocks at these elevated valuation levels over multi-year time frames. The table also notes the average returns when buying stocks at historically cheap levels, and the average return for the full time period for useful comparison.
While I don’t intend this chart to scare people out of investing in stocks, I present it so that you can understand that above-average valuation levels do present challenges. The take-away from the chart is that in high valuation environments we need to be more careful about both where we invest, and how we invest, much like vacationers coming up from low elevations to much higher elevations. This preparation allows us to identify and avoid potential problems and not only make some money from being invested in stocks, but keep gains that we have made, which can become difficult at higher valuations.
It is often useful to think of overvaluation and undervaluation this way: While the earnings growth rate on stocks stay reasonably consistent over long periods of time, what investors are willing to pay for stocks can change significantly over time. When the outlook is rosy, people are typically willing to pay more than when the outlook is negative. The change in levels around the 2008 financial crisis is a recent example of a move from overvalued to undervalued.
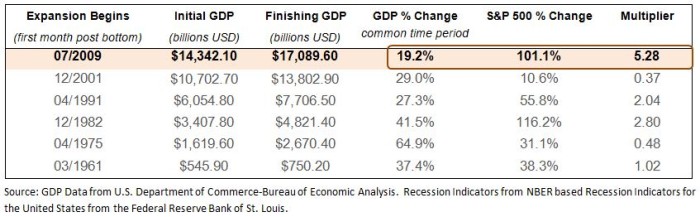
While there are many factors that can cause the stock market to reach overvalued levels, one of the most likely reasons for it in this cycle is due to the Federal Reserve policy of keeping interest rates abnormally low in an effort to stimulate the economy. In looking to quantify the potential impact of this policy we did a review of stock market growth relative to the growth of the economy during each economic expansion since the end of World War II. Since the mid-1940’s there have been 11 economic recoveries. Six of the eleven economic recoveries have lasted 54 months or longer without moving back into a recession, including the current recovery. The table below shows those five recoveries and our current recovery along with some very important data points surrounding each recovery. In comparing those five prior cases to our current expansion the three most important columns in this table are GDP % Change, which shows how much the economy had improved over the first 54 months of the economic expansion (the current expansion is the weakest), the S&P 500 % change and the Multiplier column, which divides the gain in the stock market by the amount of economic growth. The average in the expansions that have lasted 54 months or longer is 1.34%, meaning that for every 1% growth in the economy, the stock market went up an average of 1.34%. The current expansion has a multiplier of 5.28, which is more than four times the average, and nearly doubles the prior record.
One of the reasons that this unusually high number causes us some concern is because it indicates that the prices for stocks have gone up much faster than the underlying fundamentals (which is a growing economy and increased corporate profits). If we consider the similarities between recent economic recoveries and home prices you will also find that it was a good indicator of a potential “housing bubble.” For example, when you look at the 1991 recovery and the current recovery, on average for every 1% of growth in the economy, home prices went up by .54%. Then compare that to the recovery that began in the 4th quarter of 2001 which saw an increase of 2.17% in home prices for every 1% of growth in the economy (1). In comparison, the growth rate in home prices was four times the average of the other two recent economic expansions and ultimately created what we know now as the “housing bubble.” We can look back now and see that the “housing bubble” was unsustainable based upon underlying fundamentals. Will we similarly look back on the current stock market advance and likewise realize that it was unsustainable based upon the underlying fundamentals? Only time will tell.
As we have discussed in some of our prior commentaries, there is an expectation that economic growth will catch up to the current valuation of stock prices. We remain hopeful that this will happen, but we continue to see the economy struggling to get back to the 3-4% growth rates typical of many of our prior economic expansions. If investors begin to believe that the economic fundamentals will not accelerate enough to support current prices then you could see stock prices decline back to levels more in line with fundamentals. This scenario could erase a significant amount of the gains that the stock market has seen in the last few years. Our strategy in an environment such as this is to look for above-average strength in our intermediate-term risk measurement models before getting aggressive with allocations to stocks, hold above-average amounts of bonds and cash, utilize lower correlated investments and look into areas that have better valuations such as international markets to provide us with potentially more attractive investment options. As with traveling at high elevations, we need to take reasonable precautions to survive and thrive during our time in the changed environment. We continue to work diligently to measure the potential risk and reward in the various financial markets, and adjust accordingly.
Michael Ball
Lead Portfolio Manager
Sources:
1.) Home Price Indicators from S&P Dow Jones Indices LLC, National Composite Home Price Index for the United States.
Disclosure:
Opinions expressed are not meant to provide legal, tax, or other professional advice or recommendations. All information has been prepared solely for informational purposes, and is not an offer to buy or sell, or a solicitation of an offer to buy or sell, any securities or instrument or to participate in any particular trading strategy. Investing involves risk, including the possible loss of principal. All opinions and views constitute our judgment as of the date of writing and are subject to change at any time without notice. Investors should consider the investment objectives, risks, charges and expenses of the underlying funds that make up the model portfolios carefully before investing. The ADV Part II document should be read carefully before investing. Please contact a licensed advisor working with Weatherstone to obtain a current copy. The S&P 500 Index is an unmanaged market capitalization weighted price index composed of 500 widely held common stocks listed on the New York Stock Exchange, American Stock Exchange and Over-The-Counter market. Indexes are provided exclusively for comparison purposes only and to provide general information regarding financial markets. This should not be used as a comparison of managed accounts or suitability of investor’s current investment strategies. If the reader has any question regarding suitability or applicability of any specific issue discussed above, he/she is encouraged to consult with their licensed investment professional. The value of the index varies with the aggregate value of the common equity of each of the 500 companies. The S&P 500 cannot be purchased directly by investors. This index represents asset types which are subject to risk, including loss of principal. Weatherstone Capital Management is an SEC Registered Investment Advisor with the U.S. Securities and Exchange Commission (SEC) under the Investment Advisers Act of 1940. Weatherstone Capital Management is not affiliated with any broker/dealer, and works with several broker/dealers to distribute its products and services. Past performance does not guarantee future results.


