Here we are, midway through 2018 and we have an economy that is performing well, along with financial markets that are struggling to produce positive returns. If the stock market is a proxy for the underlying economy, then why the disconnect, and should we be concerned?
Consider the returns of many of the major market segments through June 30th, based on the most widely held index funds:
U.S. Stocks +2.52%
Developed Market Stocks -3.88%
Emerging Market Stocks -7.32%
High Yield Bonds -1.19%
Barclay’s Aggregate Bond -1.64%
Source: Fasttrack.net
The stock market began the year in a strong way, with the S&P 500 up more than 7% near the end of January. But concerns over rising interest rates and subsequent concerns over trade wars with some of the U.S.’ major trading partners caused the market to give back those gains, and more. While not unusual to see a market pullback of approximately 10% (particularly given the above-average amount of time without one), what has been unusual is the activity of the markets since that correction. With that said, the U.S. markets may be going through a much-needed correction.
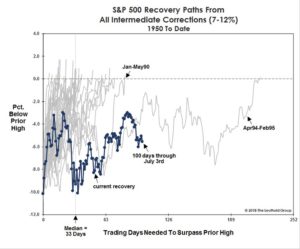
As part of our internal research, we rely on data and charts from third-party research firms. I have included a few charts from The Leuthold Group that do a great job of summarizing the unusually long nature of the stock market recovery, if what we are currently experiencing is indeed just a normal 10% correction. As you can see in Case 1 below, when the U.S. markets succumb to an intermediate correction of anywhere from 7-12%, like what was experienced in January-February this year, and there has not been a subsequent downward decline to a more pronounced correction or entry into a bear market, the market returns to new highs an average of 33 trading days later! Currently, this correction represents the second longest period without returning to a new high, if indeed the worst of it is behind us.
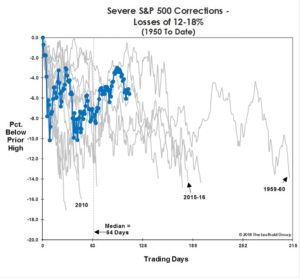
If a second stage of declines further develop into a more severe correction of -12% to -18%, then we might expect historical profiles like those contained in Case 2, and the current case is plotted along with the prior cases. The market action and trend profiles appear to fit more closely with this case than Case 1.
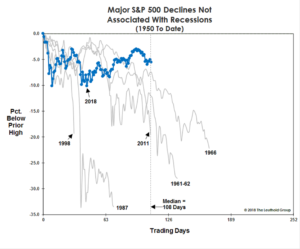
If the decline that the U.S. markets have witnessed since January is truly the initial decline into a non-recessionary bear market, then Case 3 would be the scenario to consider. I encourage you to examine the three cases and draw your own conclusions, but the way this recovery is behaving appears to look more like Case 2 than Case 1 or Case 3 to me. Yet, only time will tell.
Case 1
Case 2
Case 3
When analyzing other factors that might indicate the path for stock prices over the coming months, an important consideration at this juncture is the political cycle, with midterm elections coming up in just a few months. There is a historical tendency for the U.S. stock market to be weak before midterm elections due to increased uncertainty over future government policy changes. This thereby reduces cash flows into stocks as investors wait to see the outcome of the elections before committing their capital to the markets. This makes it easier for stocks to decline on bad news. As we look at history to give us clues as to what we might expect, here are a few statistics to keep in mind regarding midterm election years, going back to 1950:
Midterm Election Years:
S&P 500 average return, May 1st – September 30th -2.72%
Percentage (%) of midterm election years with positive returns 53%
Non-Midterm Election Years:
S&P 500 average return May 1st – September 30th 1.83%
Percentage (%) of midterm election years with positive returns 68%
The final point I want to make on the current disconnect between recent market performance and the economy is the tendency for the stock market to be a leading indicator for the economy. The stock market advance that occurred during the Great Recession began a number of months before the recession actually ended. Historically speaking, this is not unusual, as the stock market has frequently begun to decline before the economy actually slides into a recession. But, it has also moved higher before a recession has actually ended. This is one of the primary reasons that performance of the stock market is included in the Leading Economic Index© (LEI), which is published each month by The Conference Board based on government collected data.
Expectations since the last Presidential election regarding changes to the corporate tax structure have been high, and that these changes would be beneficial for U.S. businesses, allowing them to be more competitive with other nations around the world. And that government policy would become more business friendly. These expectations resulted in the U.S. stock market producing a long, sustained rally immediately following the Presidential election. Both of these things have come to pass, and corporate earnings are expected to be up by 20% compared to last year, according to FactSet Research Systems. Looking ahead and asking ourselves “what’s next?” when it comes to the stock market, we respond by searching for signs and indicators of improvement. However, if the economic news is about as good as it gets, then we may see an increase in volatility, and a decline to lower valuation levels would be expected.
Based on the conditions and points laid out above, we expect the next few months to be choppy, and we maintain an above-average probability towards a downward bias, including a decline below the market lows established in February. However, we will primarily look to our quantitative risk measurement models to provide an objective and unbiased assessment of the risk and reward potential in the market to help drive our investment decisions. Once midterm elections have passed, cash that has been stockpiled on the sidelines typically begins to move into the stock market, and we traditionally experience a period of above-average returns for stocks. That however, is a topic for a future market update.
We appreciate the opportunity to work with you and hope that you have a great summer.
Sincerely,
Michael Ball, CFP®
Lead Portfolio Manager
Sources and Disclosure:
Opinions expressed are not meant to provide legal, tax, or other professional advice or recommendations. All information has been prepared solely for informational purposes, and is not an offer to buy or sell, or a solicitation of an offer to buy or sell, any securities or instrument or to participate in any particular trading strategy. Investing involves risk, including the possible loss of principal. All opinions and views constitute our judgment as of the date of writing and are subject to change at any time without notice. The Dow Jones Industrial Average is a price-weighted average comprised of 30 significant stocks traded on the New York Stock Exchange and NASDAQ. The S&P 500 Index is an unmanaged market capitalization weighted price index composed of 500 widely held common stocks listed on the New York Stock Exchange, American Stock Exchange and Over-The-Counter market. The Dow Jones Transportation Average is a price-weighted average of 20 transport stocks in the United States. The Dow Jones Utility Average is the price-weighted average of 15 utility stocks traded in the United States. The S&P MidCap 400 Index is comprised of companies across different sector that are between $750 Million and $3 Billion in market capitalization. The S&P SmallCap 600 covers a wide range of small cap stocks, market capitalization that range from $400 Million to $1.8 Billion, and is weighted according to market capitalization. The S&P 500 Energy Sector is comprised of companies included in the S&P 500 that are classified as members of the GICS® energy sector. The MSCI World Index Ex US is a free-float adjusted market capitalization weighted index designed to measure market performance of developed markets that exclude the United States. The MSCI Emerging Markets Index is a free float-adjusted market capitalization index designed to measure equity market performance of 23 emerging market countries. Indexes are provided exclusively for comparison purposes only and to provide general information regarding financial markets and no investment can be made directly into an index. These indices or funds referenced in the article should not be used as a comparison of managed accounts or suitability of investor’s current investment strategies. If the reader has any question regarding suitability or applicability of any specific issue discussed above, he/she is encouraged to consult with their licensed investment professional. The value of the index varies with the aggregate value of the common equity of each of the 500 companies. The S&P 500 cannot be purchased directly by investors. This index represents asset types which are subject to risk, including loss of principal. Investors should consider the investment objectives, risks, charges and expenses of the underlying funds that make up the model portfolios carefully before investing. The ADV Part 2 document should be read carefully before investing. Please contact a licensed advisor working with Weatherstone to obtain a current copy. If the reader has any question regarding suitability or applicability of any specific issue discussed above, he/she is encouraged to consult with their licensed investment professional. Weatherstone Capital Management is an SEC Registered Investment Advisor with the U.S. Securities and Exchange Commission (SEC) under the Investment Advisers Act of 1940. Weatherstone Capital Management is not affiliated with any broker/dealer and works with several broker/dealers to distribute its products and services. Past performance does not guarantee future results.


