Sir John Templeton, one of the greatest money managers of the past century was famous for his observation that the bottom of a bear market or significant stock market decline was also the “point of maximum pessimism.” Historical analysis shows this tends to be true, and the opposite also tends to be correct: a peak in the stock market is often the point of maximum optimism.
My team and I have been revisiting measures of optimism and pessimism of investors recently, because in addition to high valuation levels of stocks and an extremely long-lived bull market, we are also seeing some measures of consumer confidence move to the highest levels in over a decade, and I wanted to dissect whether or not this has historically been positive or negative for stocks.
While the growth of the economy remains reasonably stable over time, the value of the stock market fluctuates much more significantly than the underlying economy as it moves through the economic cycle, and a substantial reason for this is due to investor optimism and pessimism.
If the economy is going through a period of strong growth, people become increasingly upbeat on the economy, and because things are looking good, people might be more inclined to invest in the companies that may be responsible for that growth, thus pushing prices up in the stock market. If the prices of stocks are rising faster than the earnings of companies, then the Price/Earnings ratio (P/E) expands, and people who were only willing to pay 12 times earnings when the outlook for the economy is not as rosy, may now be willing to pay 18 times earnings, because they feel that the economy is in good shape.
However, if people begin to feel that the economic outlook is not as positive, then they may become less willing to pay a premium for stocks, and then stocks may begin to go up slower than the growth of their earnings, or even decline while earnings are going up.
The chart below shows several important economic measures: The Consumer Confidence Index, the most widely followed consumer confidence measure; the stock market, as illustrated by the S&P 500; and the shaded areas that indicate periods of recession. The chart shows that once economic optimism becomes quite high and begins to roll over and move lower, significant stock market declines and recessions typically follow. The reason why recessions tend to follow is because it is not only stock market investors who begin to grow more cautious, but also banks who may have lent money too aggressively, may begin to curtail making new loans, as well as borrowers who may have overextended themselves through credit, and businesses that want to scale down as they see their prospects for growth and expansion decelerating.
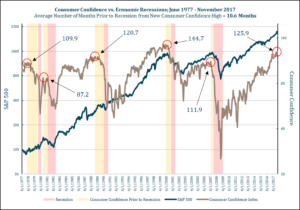
Source, St Louis Federal Reserve, University of Wisconsin, Robert Shiller website.
Conversely, when consumers have a negative view of the economy, the result is little inclination to add new money to stocks, and they fall out of favor. These negative sentiment times have historically been a good time to be a buyer of stocks, as they typically perform well as investors transition from pessimism to optimism over the next few years. While this is a simplistic example, the general pattern does hold true.
The bottom line is that when optimism for stocks is at peak levels, we need to look beyond the current positive news that is largely priced into stocks and recognize (as well as prepare), for when the news begins to turn negative. Coincidentally, the is the time when investors begin to realize that they may have overestimated how long or how well the economy was actually going to perform. To sum it up in the words of Warren Buffett, one of the other greatest investors of the past century, the key to making great money in the stock market requires a willingness to “be greedy when others are fearful, and fearful when others are greedy”. The objective measures of a few key sentiment measures are saying that we are currently seeing more greed than fear in investors’ assessment of the economy.
Stock Market Thoughts
Transitioning to the action of the stock market over the past quarter, we began the year with one of the strongest starts on record, as investors focused on the expected increase in corporate earnings that will be taking place over the next few years. But as interest rates moved higher during January, the focus shifted from the strength of corporate earnings to the possibility of accelerated interest rate increases throughout the year. As some of this concern began to subside, it appeared that the markets were beginning to settle down, but then concerns over tariffs and potential trade wars started making headlines. This resulted in a negative first quarter for most stock and bond indices.
At any given time, there are always positive and negative factors that may drive the market either higher or lower, and it seems that some days, the market chooses to pay attention to the positive factors, but then suddenly shift to focusing on the negative factors. These negative factors have quietly made their presence felt from the background, but something happens to bring them to the forefront, and investors then choose to ignore the positive and instead react to the negative. As an investor, it can be very frustrating at times.
While major news events, whether positive or negative, do at times have substantial influence on day-to-day market moves, it is the longer-term underlying factors that generate a more subtle but impactful influence on the longer-term direction of the markets. Factors such as stock valuation, interest rate trends and levels, investors’ willingness to take on risk, and cash flows among different types of investment assets. These factors have a far greater long-term impact on stock market returns.
In looking beyond news headlines and into underlying market trends, the outlook for stocks has deteriorated somewhat when we look at our short-term market measures. We have made some minor adjustments to investment holdings, and a few of our model programs have become more conservative due to stop-loss levels that were triggered. Our risk measurement models are slightly positive currently but could easily turn negative if market weakness persists.
In bonds, we have shifted much of our corporate bond exposure to floating-rate bank loan funds and shorter-term bond funds that tend to see less of an impact when interest rates rise. As I mentioned earlier, longer-term risks from high levels of optimism, valuation, and rising interest rates present challenges for the stock market, but a near doubling in the expected amount of corporate stock buybacks this year, interest rates still at historically low levels, and no significant indications that we are likely to enter into a recession in the next six months remains favorable for the markets. We will continue to update our risk measurement models frequently and make adjustments to asset allocations as necessary.
Michael Ball
Lead Portfolio Manager
Sources and Disclosure:
Opinions expressed are not meant to provide legal, tax, or other professional advice or recommendations. All information has been prepared solely for informational purposes, and is not an offer to buy or sell, or a solicitation of an offer to buy or sell, any securities or instrument or to participate in any particular trading strategy. Investing involves risk, including the possible loss of principal. All opinions and views constitute our judgment as of the date of writing and are subject to change at any time without notice. The Dow Jones Industrial Average is a price-weighted average comprised of 30 significant stocks traded on the New York Stock Exchange and NASDAQ. The S&P 500 Index is an unmanaged market capitalization weighted price index composed of 500 widely held common stocks listed on the New York Stock Exchange, American Stock Exchange and Over-The-Counter market. The Dow Jones Transportation Average is a price-weighted average of 20 transport stocks in the United States. The Dow Jones Utility Average is the price-weighted average of 15 utility stocks traded in the United States. The S&P MidCap 400 Index is comprised of companies across different sector that are between $750 Million and $3 Billion in market capitalization. The S&P SmallCap 600 covers a wide range of small cap stocks, market capitalization that range from $400 Million to $1.8 Billion, and is weighted according to market capitalization. The S&P 500 Energy Sector is comprised of companies included in the S&P 500 that are classified as members of the GICS® energy sector. The MSCI World Index Ex US is a free-float adjusted market capitalization weighted index designed to measure market performance of developed markets that exclude the United States. The MSCI Emerging Markets Index is a free float-adjusted market capitalization index designed to measure equity market performance of 23 emerging market countries. Indexes are provided exclusively for comparison purposes only and to provide general information regarding financial markets and no investment can be made directly into an index. These indices or funds referenced in the article should not be used as a comparison of managed accounts or suitability of investor’s current investment strategies. If the reader has any question regarding suitability or applicability of any specific issue discussed above, he/she is encouraged to consult with their licensed investment professional. The value of the index varies with the aggregate value of the common equity of each of the 500 companies. The S&P 500 cannot be purchased directly by investors. This index represents asset types which are subject to risk, including loss of principal. Investors should consider the investment objectives, risks, charges and expenses of the underlying funds that make up the model portfolios carefully before investing. The ADV Part 2 document should be read carefully before investing. Please contact a licensed advisor working with Weatherstone to obtain a current copy. If the reader has any question regarding suitability or applicability of any specific issue discussed above, he/she is encouraged to consult with their licensed investment professional. Weatherstone Capital Management is an SEC Registered Investment Advisor with the U.S. Securities and Exchange Commission (SEC) under the Investment Advisers Act of 1940. Weatherstone Capital Management is not affiliated with any broker/dealer and works with several broker/dealers to distribute its products and services. Past performance does not guarantee future results.


