Rising Rates and Weakening Global Growth May Hamper the Post-Election Stock Market Rally
Patrick Henry, one of the Founding Fathers of our country, is also well known for his quote that, “I know of no way judging the future but by the past.” That is sound advice and it is typically prudent to pay attention to historical probabilities, but the odds that something is likely to happen does not guarantee that it will happen, and that has been the case in the stock market over the past few months as we have been going through a period of time that has historically been negative for stocks, yet this time around they posted solid gains.
This is important to note, because we are moving into a time period for stocks that has historically been quite profitable, and we expect that stocks should do quite well if they continue to follow several decades worth of historical data. However, there are a couple of larger trends taking shape that could put a damper on things, and they have already begun to rattle the stock market.
Let’s start with what history tells us to expect from the stock market in the months after the midterm elections. This has historically been a very positive time for stocks. Let’s recap some of the data that we highlighted in our special market commentary that we published in September. In looking at the performance from midterm election years from 1950 through 2014, here are the average returns.
Midterm Election Years (1950 – 2014)
S&P 500 Profitable Cases
October and post-election (October – April) 19.39% 94%
If we dig further to determine any potential impact to market performance from the results of the midterm elections, we find that although it does make some difference if control of Congress changes, or if pre-election market performance was positive or negative, the tendency for a strong stock market rally remains intact. The market gains tend to be stronger if there is weakness before midterm elections, and if control of congress does not change, as shown in the following statistics:
Congressional Change of Control Post-Election S&P 500
Control of Congress remains unchanged +22.46%
Control of Congress changes +13.76%
Performance leading up to mid-term elections Post-Election S&P 500
Positive U.S. stock market returns, (April-September) +14.99%
Negative U.S. stock market returns, (April-September) +24.35%
The fact is, regardless of the outcome of the elections, performance of the U.S. stock market tends to be quite strong shortly before, and in the months following the mid-term elections.
So, history tells us to expect strong gains between now and May of next year. However, we have two trends that have been acting as headwinds that could dampen the post-election rally.
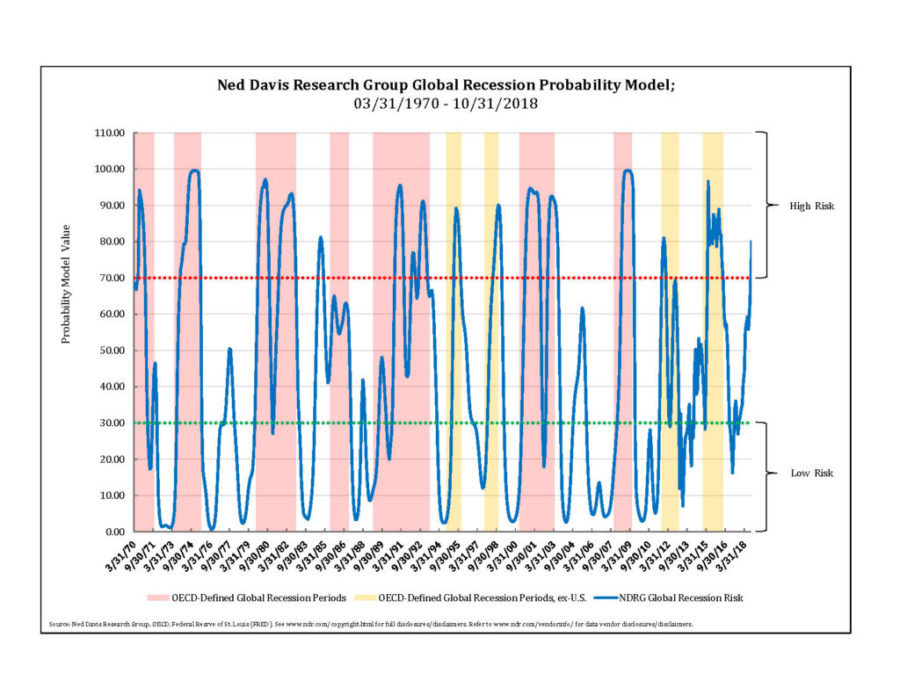
One important factor that may minimize the impact of the traditional post-election rally is the increasing amount of foreign economic weakness that is beginning to show up. One model that we look at for this utilizes Leading Economic Indicator data from 35 counties around the world and then measures how strong and weak that data is. The chart below shows the model, with zones for high recession risk, moderate risk, and low risk. The shaded areas are periods defined as a global recession. As you can see, the model has been useful in identifying periods of economic weakness.
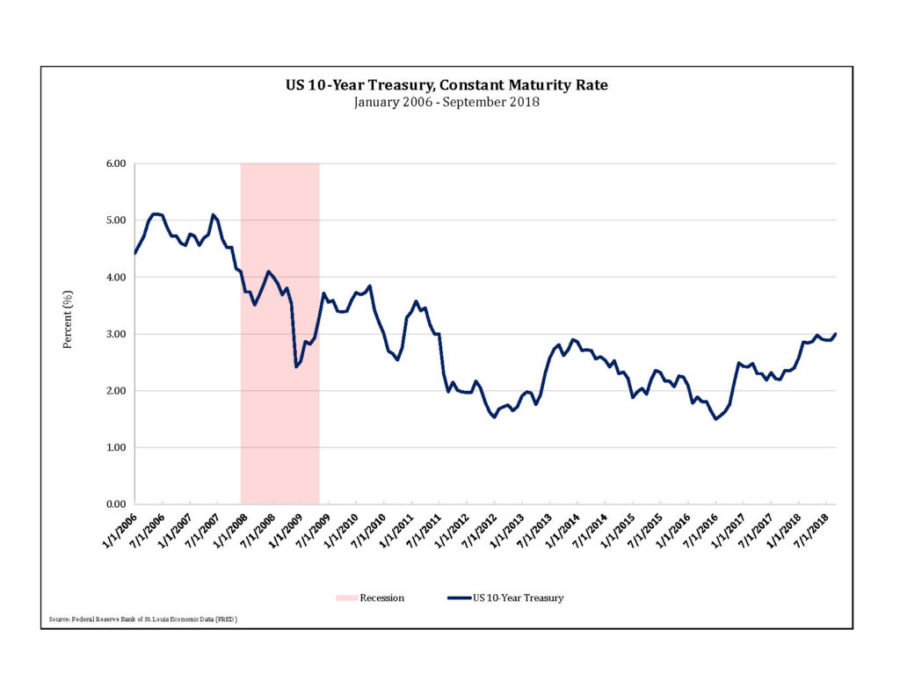
A second factor that could impede the post-election rally is the rise of intermediate and longer-term interest rates moving to multi-year highs, and the likelihood that this may continue due to very large amounts of refinancing and new debt. The chart below shows the yield on 10-year government bonds from early 2006 until now. Yields came down following the financial crisis of 2007-2008 and have ranged between 1.5% and 3% for more than five years. Earlier this month we saw the yield on 10-year government bonds move to the highest levels we have seen since 2011, and we have a significant upcoming supply of bonds that could continue to put upward pressure on bond yields going forward.
While the most recent tax reform act did help to improve the corporate tax code to make it more competitive with the rest of the world, it does raise the budget deficit, and the U.S. government is expected to need to borrow more than $1 trillion dollars to fund the deficit next year, up significantly from the nearly $550 billion that it needed to borrow in 2017.
In addition, the government needs to refinance $4.3 trillion of government debt over the next 12 months, this is about $500 billion more than the prior year. Finally, the Federal Reserve Bank is working to shrink the amount of loans that it has on its balance sheet from the purchases they had made in the years following the Great Recession. This will be another source of supply due to the increasing amount of bonds that the Federal Reserve Bank will not be rolling over in the future. This supply/demand imbalance will likely require an increase in interest rates in order to entice enough investors to want to sell other investments to buy bonds, and this will become an increasing headwind for stocks.
As we look at how this has been impacting the financial markets, the U.S. stock market has been able to recoup from its correction of January and early February and return to a new high in September, but it was the only global market to reach a new high in September. We have seen most foreign stock markets showing increasing weakness since May, with both developed and emerging markets hitting new lows for the year in October.
U.S. stocks have had a volatile October so far, with a quick two-day drop of -6.9% on fears of rising interest rates, weakness in the currencies of some emerging markets, and that some areas of the stock market such as technology have become overvalued. Does this recent increase in volatility override the historical post-election rally? Not necessarily, but it does increase the risk that we will not follow the same pattern.
Looking back through the midterm election years since 1970, we have seen at least one market pullback of 5% or more sometime during the post-election rally period, with the average decline being -7.49%, so the current pullback looks quite normal in a historical context, but we will continue to monitor things closely as the increase in global recession risk has increased the probability that we may have entered the initial stages of a bear market. If needed, we will adapt our asset allocations more defensively should we see increased risks, but history indicates that we are likely to see additional gains over the next several months.
Michael Ball, CFP®
Lead Portfolio Manager
Sources and Disclosure:
Opinions expressed are not meant to provide legal, tax, or other professional advice or recommendations. All information has been prepared solely for informational purposes, and is not an offer to buy or sell, or a solicitation of an offer to buy or sell, any securities or instrument or to participate in any particular trading strategy. Investing involves risk, including the possible loss of principal. All opinions and views constitute our judgment as of the date of writing and are subject to change at any time without notice. The Dow Jones Industrial Average is a price-weighted average comprised of 30 significant stocks traded on the New York Stock Exchange and NASDAQ. The S&P 500 Index is an unmanaged market capitalization weighted price index composed of 500 widely held common stocks listed on the New York Stock Exchange, American Stock Exchange and Over-The-Counter market. Indexes are provided exclusively for comparison purposes only and to provide general information regarding financial markets and no investment can be made directly into an index. These indices or funds referenced in the article should not be used as a comparison of managed accounts or suitability of investor’s current investment strategies. If the reader has any question regarding suitability or applicability of any specific issue discussed above, he/she is encouraged to consult with their licensed investment professional. The value of the index varies with the aggregate value of the common equity of each of the 500 companies. The S&P 500 cannot be purchased directly by investors. This index represents asset types which are subject to risk, including loss of principal. Investors should consider the investment objectives, risks, charges and expenses of the underlying funds that make up the model portfolios carefully before investing. The ADV Part 2 document should be read carefully before investing. Please contact a licensed advisor working with Weatherstone to obtain a current copy. If the reader has any question regarding suitability or applicability of any specific issue discussed above, he/she is encouraged to consult with their licensed investment professional. Weatherstone Capital Management is an SEC Registered Investment Advisor with the U.S. Securities and Exchange Commission (SEC) under the Investment Advisers Act of 1940. Weatherstone Capital Management is not affiliated with any broker/dealer and works with several broker/dealers to distribute its products and services. Past performance does not guarantee future results.


