Tug of War
Weakening Global Economic Growth and Positive Post-Election Historical Trends
2018 has been a challenging year for financial markets around the world. The combination of slowing economic growth outside of the U.S., interest rate hikes by the Federal Reserve, trade and tariff skirmishes with major trading partners, and the historical tendency for investors to delay investing in, or even redeem money from stocks before midterm elections has made for an eventful year. Yet, we believe that some substantially important negative factors for the stock market are poised to turn meaningfully positive. Therefore, I felt that it would be useful to look at the potential implications of post-midterm seasonality, and discuss how this has, and may be, impacting investment portfolios managed by Weatherstone.
When making investment decisions, we consider factors both internally and externally of the financial markets that influence our investment process. Two factors we consider in making investment decisions are the performance of stock markets outside of the U.S. and seasonal factors, which are often driven by cash flows into the market. Global stock market performance has had a substantial impact on our investment positioning this year, and we anticipate that the historically strong seasonal stock market performance that typically occurs after the midterm elections will have a significant impact in the coming months.
Foreign Market Weakness
Outside of the U.S., stocks have struggled this year; we recently observed that 22 of 47 global stock markets were 10% or more below their one year high, and more than 75% of the global stock markets were trending downward. This global weakness has held our short-term stock market model in a negative position for both domestic and international stocks, resulting in generally defensive positioning in the portfolios over the past several months. And yes, it is frustrating at times to see that these historically significant indicators are signaling to be defensive, yet the primary market that most investors focus on – the U.S. stock market – continues to move higher. I fully understand and appreciate that.
I have been asked why foreign weakness would make us cautious about owning U.S. stocks. The answer is simply that the most sustainable stock market movements tend to be global in nature, and we have found that by not including foreign market performance into our risk measurement models has lead to lower returns and larger drawdowns over time. But also, by taking a global view of stock market performance, it can better alert us to pending sources of higher market volatility much sooner than looking at just the U.S. stock market. Therefore, it is imperative that we take a 360 degree view to better position the portfolios. Figure 1 is an excellent representation of what may be causing this foreign market weakness:
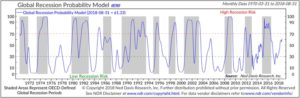
Figure 1
The chart in Figure 1 was generated from a model that collects Leading Economic Indicator (LEI) data from more than 40 countries around the world, and then analyzes the strength and/or weakness of that data. Readings above the red line indicate global recession risk to be high, while readings below the green line indicate global recession risk to be fairly low. The shaded areas represent global recessions, as determined by the Organization of Economic Cooperation and Development, which seeks to coordinate economic policies and address common economic problems, as well as encourage trade with countries from around the world. The shaded areas from 2000 – 2003 and 2007 – 2008 may seem very familiar, as those were recessions that were also experienced here in the U.S. The shaded areas from 2011 – 2012 and 2015 – 2016 may not feel as familiar; these recessions were primarily contained to Europe and its counterparts, due to the European Debt Crisis in 2011. A general economic slowdown in Europe, Asia, and other parts of the world was the catalyst for the recession from 2015 – 2016.
While the 2011 and 2015 global recessions did not directly impact the U.S., they still made a sizeable impact on the market, with the U.S. stock market declining by -19.4% in 2011 and -14.2% in 2015. Looking at the current levels of where the indicator is relative to historic global recessions, it has typically trended upward, followed by global recession, with 1985 and 2005 being the exceptions. We will be keeping a very close eye on this. Conversely, one encouraging factor that indicates we may be seeing a moderation in recession risk comes from the Citigroup Economic Surprise Index, which is based on whether economic data is trending stronger or weaker than expected. Figure 2 shows that across the world’s ten largest economies, after a significant amount of economic data being reported was below expectations, over the past few months, that data has been strengthening, trending more in line with analyst expectations. In addition, we are seeing many foreign stock markets beginning to stabilize and show some signs of resuming an upward path. This should prove positive for the foreign components of our risk measurement and short-term stock market models in the near term.
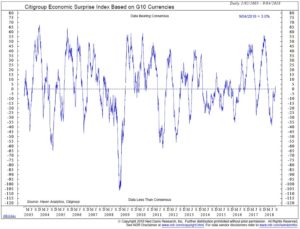
Figure 2
Seasonality and the Post-Election Stock Market Rally
There is a historical tendency for U.S. stocks to significantly strengthen as we near the end of the midterm elections – this is the other major factor we are closely monitoring. Asset flows into the stock market usually slow as midterm elections approach, and then increase again after the election, historically speaking. Breaking down the four-year presidential election cycle into multi-month blocks, one can see that weak stock market performance typically comes in the months prior to the midterm elections, while very strong returns come in the months following the election. I covered this in the most recent quarterly newsletter, but I believe it is worth revisiting, along with some additional analysis:
Midterm Election Years (1950 – 2014)
S&P 500 Profitable Cases
Pre-election (May – September) -2.72% 53%
October and post-election (October – April) 19.39% 94%
If we dig further to determine any potential impact to market performance and midterm elections we find that although it does make some difference if control of Congress changes, or if pre-election market performance was positive or negative, the tendency for a strong stock market rally remains intact. The market rallies tend to be stronger if there is weakness before midterm elections, and if control of congress does not change.
Congressional Change of Control Post-Election S&P 500
Control of Congress remains unchanged +22.46%
Control of Congress changes +13.76%
Performance leading up to mid-term elections Post-Election S&P 500
Positive U.S. stock market returns, April-September +14.99%
Negative U.S. stock market returns, April-September +24.35%
The fact is, regardless of the outcome of the elections, performance of the U.S. stock market tends to be quite strong shortly before, and in the months following the mid-term elections. While we expect that we may have several months of positive stock market performance in front of us, we do recognize and have discussed in several of our quarterly letters, a number of the longer-term challenges that the market faces. From high valuations, to rising interest rates, stretched profit margins, record-high debt levels, and global recession risk. These factors are still out there, but, strong post-election seasonality may once again minimize the chances that these factors will weigh heavily on the stock market until after the post-election rally has run its course.
In closing, we know it has been a challenging year for our risk-managed investment strategies, due to the crosscurrents of domestic strength and international weakness. But we see improving signs on the horizon, and that global economic and stock market performance may begin to synchronize, laying a more solid foundation for a stock market advance to occur. Factoring in the strength typically associated with post midterm elections, we anticipate stocks to be strong over the coming months, and expect that strength to add robust performance, positively impacting our investment portfolios through the end of the year and on into the first several months of 2019.
Sincerely,
Michael Ball, CFP®
Founder & Lead Portfolio Manager
Sources and Disclosure:
Opinions expressed are not meant to provide legal, tax, or other professional advice or recommendations. All information has been prepared solely for informational purposes, and is not an offer to buy or sell, or a solicitation of an offer to buy or sell, any securities or instrument or to participate in any particular trading strategy. Investing involves risk, including the possible loss of principal. All opinions and views constitute our judgment as of the date of writing and are subject to change at any time without notice. The Dow Jones Industrial Average is a price-weighted average comprised of 30 significant stocks traded on the New York Stock Exchange and NASDAQ. The S&P 500 Index is an unmanaged market capitalization weighted price index composed of 500 widely held common stocks listed on the New York Stock Exchange, American Stock Exchange and Over-The-Counter market. Indexes are provided exclusively for comparison purposes only and to provide general information regarding financial markets and no investment can be made directly into an index. These indices or funds referenced in the article should not be used as a comparison of managed accounts or suitability of investor’s current investment strategies. If the reader has any question regarding suitability or applicability of any specific issue discussed above, he/she is encouraged to consult with their licensed investment professional. The value of the index varies with the aggregate value of the common equity of each of the 500 companies. The S&P 500 cannot be purchased directly by investors. This index represents asset types which are subject to risk, including loss of principal. Investors should consider the investment objectives, risks, charges and expenses of the underlying funds that make up the model portfolios carefully before investing. The ADV Part 2 document should be read carefully before investing. Please contact a licensed advisor working with Weatherstone to obtain a current copy. If the reader has any question regarding suitability or applicability of any specific issue discussed above, he/she is encouraged to consult with their licensed investment professional. Weatherstone Capital Management is an SEC Registered Investment Advisor with the U.S. Securities and Exchange Commission (SEC) under the Investment Advisers Act of 1940. Weatherstone Capital Management is not affiliated with any broker/dealer and works with several broker/dealers to distribute its products and services. Past performance does not guarantee future returns.


