The health or weakness of the economy is something that directly impacts the financial markets, our communities and our families. Given the mixed nature of recent reports on the economy, I wanted to spend some time covering a few items that are important in keeping some of the recent economic headlines in perspective.
Inflation
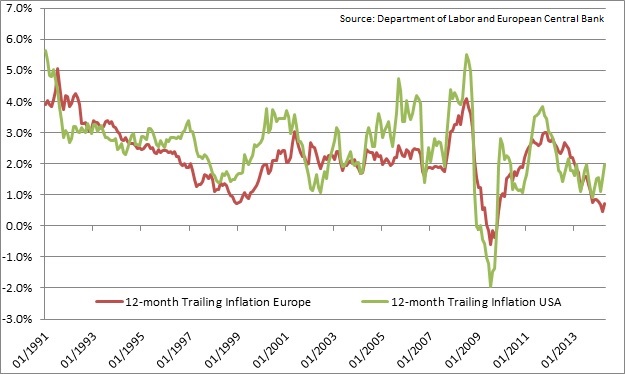
We have seen the annual inflation rate moving higher in recent months, and the 12 month inflation rate currently stands at nearly 2%, which is up from a trailing annual rate of about 1.2% at the end of 2013. Many people are wondering if this is the start of a longer-term trend toward higher inflation – in my opinion, not yet. There can be both domestic and global factors that impact inflation. In the United States, the combination of a difficult winter in some parts of the country, a drought that is pushing up food costs, and tension in Ukraine and the Middle East pushing up oil prices has caused prices across many categories to rise. If we look outside of the United States, we find that the inflation rate in Europe tends to track our inflation rate pretty well over time. As can be seen in the chart below, Europe has been experiencing declining inflation, and there have been concerns about deflation becoming prevalent in the Eurozone. Inflation has slowed to low enough levels that the European Central Bank (ECB) recently became the first major Central Bank to move to a negative interest rate by reducing the interest rate for money held at the ECB from 0% to -.1%, in effect charging banks to deposit their money. This move is designed to further stimulate lending by banks and increase both the growth rate of the economy (currently less than 1%) and move inflation closer to a 2% level.
Economy
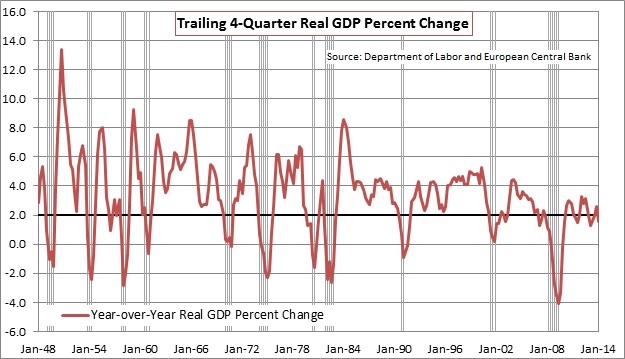
The final report for first quarter economic growth showed that the U.S. economy contracted at a nearly 2% annualized rate during the first quarter. Fortunately much of the weakness was likely due to severe winter weather in parts of the country, and growth is expected to rebound over the next few quarters. The chart below shows the rolling four-quarter growth of the U.S. economy, the darker line shows the level of 2% annual growth, and the shaded lines show the recessions we have had since the end of WWII. As we have discussed in prior commentaries, the 2% growth line is important because historically there has been a 70% probability that the economy will go into a recession within the next 12 months when economic growth drops below the 2% threshold. In looking at the chart, you can see that this is now the third time since the end of the recession that we have dropped below the 2% threshold. In the other prior two cases, we have managed to stay out of a new recession, and I expect that we are likely to do so this time as well, as Europe currently retains its modest economic growth and the global economy continues to show some improvement. The chart also illustrates the continued weak state of the economy and the difficulty which it has in sustaining growth when encountering even moderate setbacks. In the recently released minutes of the Federal Reserve’s Open Market Committee Meeting they noted that “neither monetary policy nor fiscal policy was seen as being well positioned to help the economy withstand adverse shocks”.
Unemployment
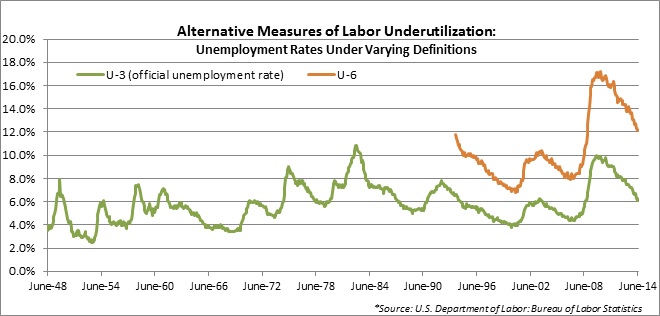
The most recent report on the unemployment rate showed a drop to 6.1%, which is now much closer to the average unemployment rate since 1948 of 5.8%*. The drop in the unemployment rate is good, yet for many people it still feels like we are in a recessionary environment. How can we reconcile the feeling that many people have about the economy with the employment numbers that the government is reporting? Part of the problem is the rather narrow definition that the government uses in its primary measure to define who is unemployed. In the U-3, the government’s primary measure, if a person moves from full-time to part-time work, they are still considered employed, and if a person gets discouraged from looking for a job and gives up looking they are no longer considered unemployed. The government has several other measures for unemployment. The government’s U-6 measure typically provides a more comprehensive definition of unemployment by also counting all persons marginally attached to the labor force, plus total part time for economic reasons, as a percentage of the civilian labor force plus all persons marginally attached to the labor force. The chart below shows the comparison of the two unemployment rates. Although it is more difficult to make long-term comparisons since the U-6 data only goes back to the mid-1990’s, an important comparison to make is that current unemployment, as measured by the U-3 measure is near the levels of 2004 while the U-6 unemployment rate is still about two percentage points higher than back in 2004. This shows that the decline as measured by the U-6 measure illustrates that the labor market is slower than normal in returning to pre-recession levels. The data suggests that there is no easy solution to solve the problems with job creation and the quality of jobs being created. There are problems ranging from lack of capital for smaller businesses, job skill gaps, government policy uncertainty, and technology eliminating middle class jobs. Lack of job creation leads to lower levels of income growth and consumption spending, both of which are needed for a healthy economy.
In summary, my feelings on our current state of affairs is that while above-average inflation is a challenge that we are likely to face down the road, it should not become a sustained problem until we have stronger economic growth and inflationary pressures increasing both domestically and abroad. It is a fact that the current economic recovery remains the weakest economic rebound over a similar time period since the end of WWII. Reaching an economic growth rate similar to prior recoveries and sustaining it so that we can enjoy robust job growth and economic gains remains an elusive goal so far, despite the extensive efforts of both the government and Federal Reserve. The stimulative efforts have boosted many segments of the financial markets on expectation that the economy will return to “normal” strength. However, the inability of the economy to return to the expected level of growth remains a significant risk to both the ability to maintain the recovery if unexpected problems arise, and to maintain financial markets that are selling at historically high valuation levels. As a result we remain cautions toward markets where lofty prices are more a function of faith in Central Banks that a reflection of robust economic growth. We continue to monitor these and other important economic measures as we measure the longer-term risk vs. reward in the financial markets.
Sincerely,
Michael Ball
Lead Portfolio Manager
Disclosure: Opinions expressed are not meant to provide legal, tax, or other professional advice or recommendations. All information has been prepared solely for informational purposes, and is not an offer to buy or sell, or a solicitation of an offer to buy or sell, any securities or instrument or to participate in any particular trading strategy. Investing involves risk, including the possible loss of principal. All opinions and views constitute our judgment as of the date of writing and are subject to change at any time without notice. Investors should consider the investment objectives, risks, charges and expenses of the underlying funds that make up the model portfolios carefully before investing. The ADV Part II document should be read carefully before investing. Please contact a licensed advisor working with Weatherstone to obtain a current copy. The S&P 500 Index is an unmanaged market capitalization weighted price index composed of 500 widely held common stocks listed on the New York Stock Exchange, American Stock Exchange and Over-The-Counter market. Indexes are provided exclusively for comparison purposes only and to provide general information regarding financial markets. This should not be used as a comparison of managed accounts or suitability of investor’s current investment strategies. If the reader has any question regarding suitability or applicability of any specific issue discussed above, he/she is encouraged to consult with their licensed investment professional. The value of the index varies with the aggregate value of the common equity of each of the 500 companies. The S&P 500 cannot be purchased directly by investors. This index represents asset types which are subject to risk, including loss of principal. Weatherstone Capital Management is an SEC Registered Investment Advisor with the U.S. Securities and Exchange Commission (SEC) under the Investment Advisers Act of 1940. Weatherstone Capital Management is not affiliated with any broker/dealer, and works with several broker/dealers to distribute its products and services. Past performance does not guarantee future results.


